


Updated: 05 / 10 / 2026
INP (Interaction to Next Paint): what it is, how to measure it and how to improve it

Bruno Díaz
—Marketing Manager
SectorLet's talk about
INP (Interaction to Next Paint) is the Core Web Vitals metric that measures a page's responsiveness: how long it takes to react visibly when someone clicks, taps the screen or presses a key. Google adopted it in March 2024 to replace FID, and it is one of the metrics most sensitive to the JavaScript a website loads, so it is often one of the hardest to improve.
This guide explains how it is calculated, which values are considered good, how to measure it with real data and what to do to improve it. It is part of the technical SEO content we work on from our SEO agency.
Contents:
What is INP?
INP assesses a page's responsiveness by observing the latency of every click, tap and key press that happens during the visit. The value reported is that of the longest interaction. On pages with many interactions, one in every 50 is discarded so that isolated spikes are not penalised.
The latency of an interaction is the time from the user's action until the browser can paint the next frame with a visible response. That is why INP does not measure how long everything the action triggers takes to complete, such as a request to the server, but how long the page takes to react in the user's eyes.
A common example is submitting a contact form. Pressing the button sets off several processes: sending the confirmation email, registering the contact in the CRM, notifying the analytics tools. If all of that runs before the page shows anything, the user sees a frozen button for a few seconds and INP is high. If the page first shows the confirmation or a “Sending…” notice and leaves the rest of the work for later, INP drops.
The three phases of an interaction
- Input delay: the time until the browser starts processing the action. It tends to grow because the main thread is busy with another task.
- Processing time: how long the event handlers linked to the interaction take to run.
- Presentation delay: the time from when those handlers finish until the browser paints the frame.
Knowing which of the three is losing the time is what guides the optimisation.
Which interactions count
Mouse clicks, taps on touchscreens and key presses, physical or on-screen, count. Scrolling, hovering and zooming do not. Interactions inside embedded iframes do count, such as the play button of an embedded video.
What is a good INP value?
Google assesses INP at the 75th percentile of visits, separately for mobile and desktop:
- 200 milliseconds or less: good responsiveness.
- Between 200 and 500 milliseconds: needs improvement.
- Over 500 milliseconds: poor responsiveness.
A page may have no INP value if nobody interacts with it, if users only scroll or hover, or if there isn't enough data from Chrome users.
What are Core Web Vitals?
INP is one of the three Core Web Vitals metrics, the set Google uses to measure a page's user experience:
- LCP (Largest Contentful Paint): how long the main content takes to appear. Good is up to 2.5 seconds.
- INP: responsiveness to interactions. Good is up to 200 milliseconds.
- CLS (Cumulative Layout Shift): visual stability, meaning unexpected movement of elements. Good is up to 0.1.
They are part of the page experience signals Google takes into account for ranking. They are one signal among many and do not replace the relevance of the content, but improving them directly benefits the user.
INP vs FID
FID (First Input Delay) only measured the delay of the first interaction, that is, the time until the browser started processing it. INP observes every interaction and covers the full journey: input delay, processing and presentation.
That is why a website that passed with FID can fail with INP. Before, it was enough for the first response to be quick. Now everything that happens afterwards counts too. Google replaced FID with INP on 12 March 2024.
How to measure INP
The best source is field data, collected from real users, because INP depends on what each visitor does on the page.
Field data
- PageSpeed Insights: shows data from real Chrome users (CrUX) when the URL or origin has enough traffic.
- Search Console: the Core Web Vitals report groups URLs with poor INP or INP that needs improvement.
- Real user monitoring (RUM) and the web-vitals library: measure INP on your own website and show which interaction causes it. The data can be sent to Google Analytics or another tool for analysis.
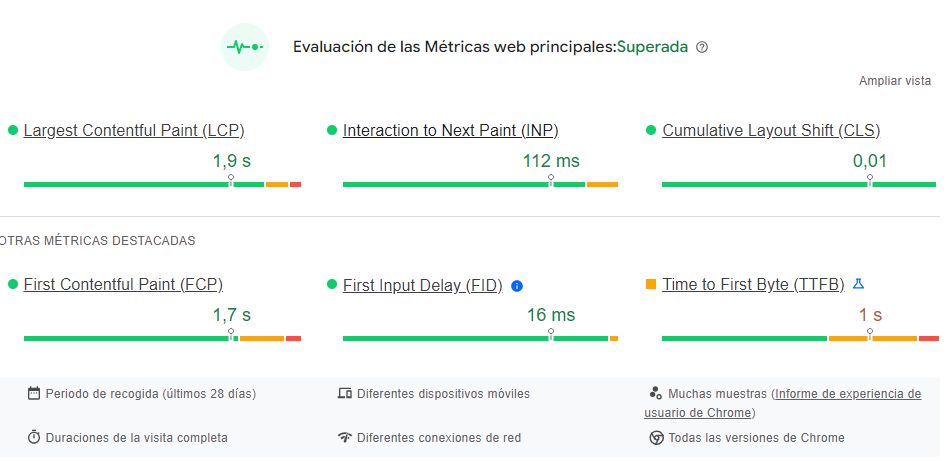
CrUX tells you whether there is a problem, but not what causes it. It also comes only from Chrome users: according to Google's documentation, Safari does not support it.
Lab data
In the lab, INP depends on the interactions you simulate, so it does not replace field data. Some tools only observe the page load and do not report INP. In that case, Total Blocking Time (TBT) works as a rough indicator, although it is not equivalent to INP.
To reproduce slow interactions, open the page in Chrome, use the DevTools Performance panel and repeat the usual journeys: opening the menu, using the internal search, expanding content blocks, submitting a form. Interact while the page is still loading too, which is when the main thread tends to be busiest. Google explains the method in its guide to diagnosing slow interactions in the lab.
Common causes of a high INP
- Long JavaScript tasks on the main thread, especially during loading.
- Heavy event handlers: they do too much work before the page can paint a response.
- Third-party scripts: Google Tag Manager tags, chat tools, widgets and advertising.
- Large DOM and complex styles: the more elements and rules, the more it costs to recalculate and paint after each interaction.
- Layout changes that force the page to be recalculated several times in a row.
Network requests do not penalise INP by themselves. What counts is whether the page can paint a response while those requests are resolved.
How to improve the INP of a website
The first step is to identify which interactions are slow, using field data if you have it and lab tests if not. The second is to see which phase is losing the time and act on it.
If the problem is input delay
Reduce long tasks during loading, defer scripts that are not needed at the start and review Google Tag Manager tags and plugins that add their own JavaScript.
If the problem is processing time
Break long tasks into smaller parts and hand control back to the browser between them. Limit what the event handler does to the minimum needed to show the response and leave the rest for later. In the form example, show the confirmation first and send the data to the CRM and analytics afterwards. For heavy calculations, consider web workers, which move them off the main thread.
If the problem is presentation delay
Reduce the size of the DOM, simplify styles and avoid layout changes that force the page to be recalculated several times in a row.
Adding a quick visual response indicator helps, but it only works if the main thread is free to paint it. If not, the cause has to be tackled. The web.dev collection of guides on optimising INP details each technique.
Frequently asked questions
Can I measure INP with lab tools alone?
Not entirely. In the lab, the value depends on the interactions simulated and may not reflect what users experience. The ideal is to start with field data and use the lab to reproduce and fix the problems.
What if my page has no INP value?
It is usually because users do not interact with it, because they only scroll, or because there isn't enough data. In those cases the value will appear once there are more visits with measurable interactions. In the meantime, test the key journeys yourself in the lab.
Does INP affect rankings?
It is part of the page experience signals, but one signal among many. Improving it does not guarantee higher positions, although it does improve the experience of people using the website, and with it the likelihood of conversion.
If you need help diagnosing and improving your website's INP, our SEO agency can review it: let's talk.
About the author
Bruno Díaz — Marketing Manager
Professional with a long career as a communication and digital marketing consultant, specializing in SEO, SEM and web projects. As Marketing Manager of the agency, I coordinate a great team of digital marketing technicians of which I am very proud.
Related news

Hello! drop us a line
How long your website takes to react to a click, a tap or a key press, how to measure it with real data and what to do when INP spikes.