


Updated: 27 / 01 / 2024
Professional WPO audit + case study

Bruno Díaz
—Marketing Manager
SectorLet's talk about
In this post we offer you everything you need to carry out a professional WPO audit: fundamentals, tools and tips that will help you.
Table of contents
1. What is WPO?
WPO stands for Web Performance Optimization. In Spanish it would be something like Web Performance Optimization. It is the set of actions that we can carry out at website and server level to make our site load as fast as possible, especially on mobile devices.
2. Why is WPO important?
There are many reasons, but we are going to focus on the most important ones:
- Savings: an optimized website consumes fewer resources, and that will allow us to reduce web hosting costs and its corresponding impact on the environment.
- SEO: Google’s Core Web Vitals are one of the signals that algorithms take into account for ranking.
- Better user experience: poor web performance means a bad experience for our users, especially on mobile devices with slow connections. As a result, WPO will have a direct impact on key aspects such as bounce rate, pages viewed, time on page and, most importantly, CONVERSIONS.
3. What a WPO audit should include
3.1. Initial situation analysis
Using external tools and the browser itself, we must take a snapshot of the current performance. It is important to do this with different methodologies and configurations, and to run the audit not only on the home page, but also on sets of URLs that share patterns (for example blog posts, service pages, category or brand pages, etc.).
3.2. Education and documentation
It is an extremely technical topic, but we recommend including a documentation section that makes it possible to justify the importance of our actions and educate the client. It is crucial to make a good selection of sources, with as much authority as possible (essentially Google’s own documentation is always the most reliable, as some information provided by interested parties may be biased).
3.3. Recommendations and prioritization
In this section you should list the possible actions to implement. But we need to go further. Once we have the listing, we must filter and weigh it based on two principles: prioritize what will have the greatest impact on performance, with minimal resource investment.
Up to this point, we would have the strict part corresponding to a WPO audit: we have taken a snapshot, documented the needs and issued a series of recommendations. But usually the client will ask us to go further, either by implementing the improvements or by monitoring the implementations later when they have been carried out by an external team. In that case, we would continue with:
3.4. Testing the website
It wouldn’t be the first time that, after a WPO optimization, we end up with a site that is fast, but doesn’t work. The goal is not to pass a Speed Test, it is to load the website faster without losing functionality. In this section, you should conduct a very thorough web QA, as if you had just launched the website. Test the site on different devices and browsers, interact with menus and buttons, submit forms, process purchase orders in an e-commerce, etc.
If resources are available, we recommend not implementing WPO improvements directly on the live, production site. The ideal scenario is to work on a clone of the website in a server environment identical to the one in production, run the tests there and, when everything is fine, push to production. Although unfortunately that will not always be feasible.
3.5. Comparison with the initial situation
Once the set of actions has been implemented, we must dust off what we stored in point 3.1 about the initial situation analysis. Using the same tools and configurations, we will measure the improvements obtained in the main metrics. It is important to choose them well and not overwhelm the client with too much data: 4–5 metrics in 2–3 tools should be enough.
3.6. Monitoring user experience (GSC, Locker…)
In the end, tools give us simulations of web performance based on specific assumptions, from a certain location, device and browser. But those are not the real users of our website, who are the true target. That is why it is important to analyze the real experience of our users through tools such as Google Search Console, which gives us a great report. Also, with Locker Studio we can configure a report that evaluates every month whether we are meeting the Core Web Vitals, which is great (see the CruX report).
3.7. Future recommendations
The set of actions resulting from the audit is very important, but once it is closed we must issue recommendations so that when the client makes content changes they do not ruin everything. We should especially standardize how photos and videos will be uploaded in the future, as these are the most sensitive elements in terms of load.
4. Tools for your WPO audit
It is difficult to make a selection, as there are many tools and all of them have some interesting feature. Here we list the ones we use most in most projects; note that it is not necessary to use all of them in a single project, far from it.
4.1. Lighthouse with Chrome (f12)
It is free, the most reliable, and you have it on your PC. You just need to open Chrome (preferably in incognito mode and without extensions), press F12, and you’ll find it there. There you will see performance in your own scenario, or you can change the configuration to simulate the ones used by external tools or Google itself.
4.2. Page Speed
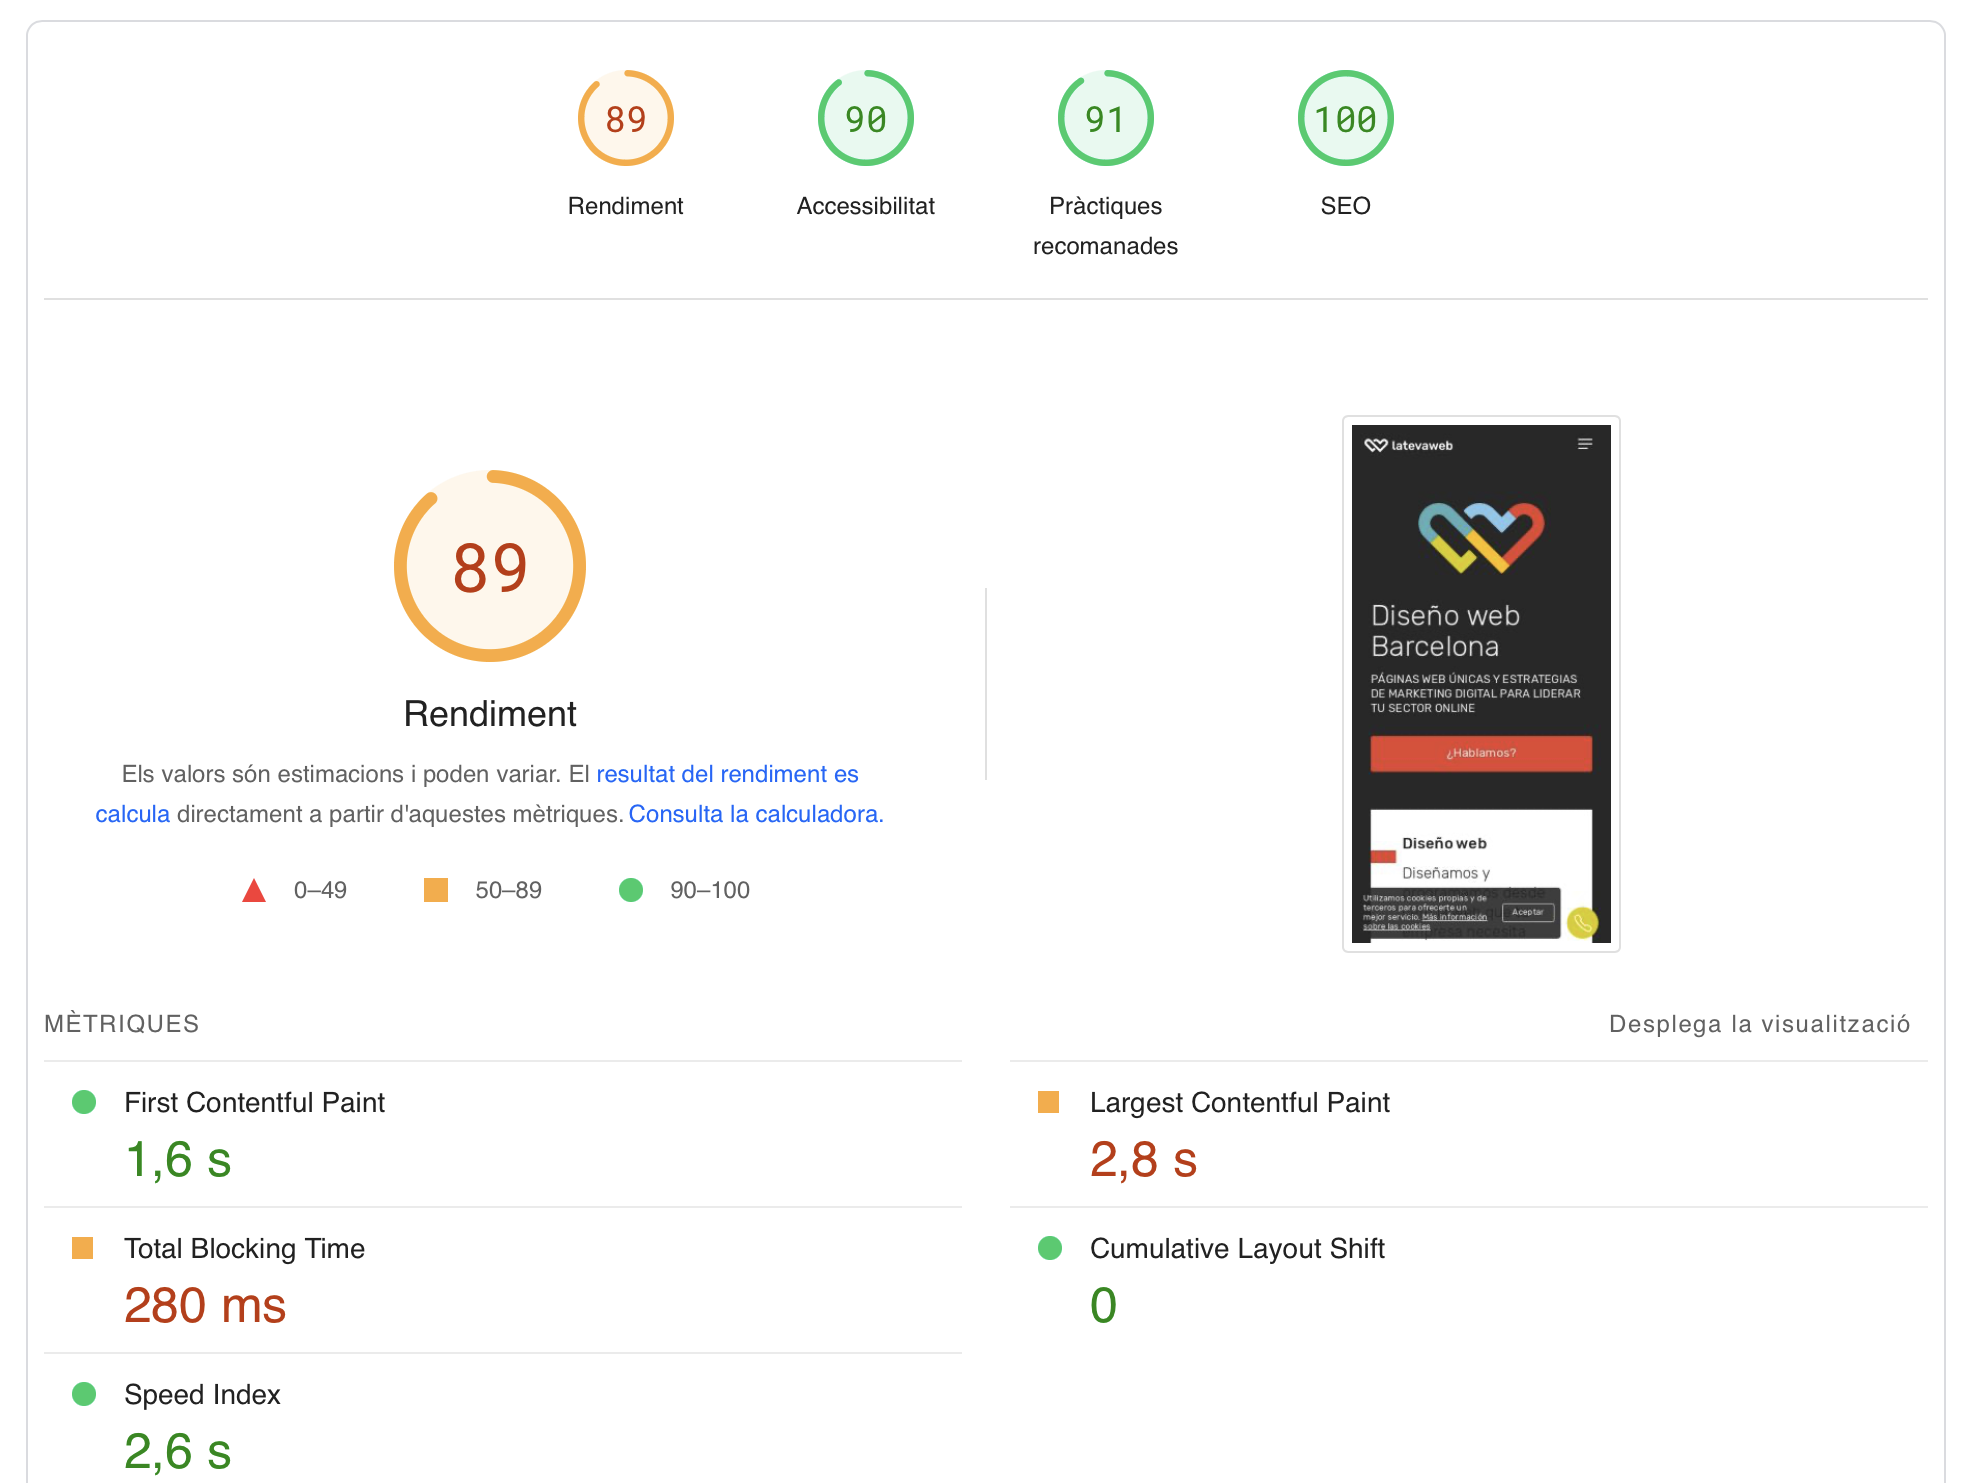
Page Speed is Google’s reference tool and most likely the one your client will check, so even if you don’t love it, it will have to be your reference. No one wants to see a red score and, no matter how much you explain that it is not the most relevant aspect, it won’t fly. At least aim for orange. In any case, what we really care about is meeting the needs of our real users: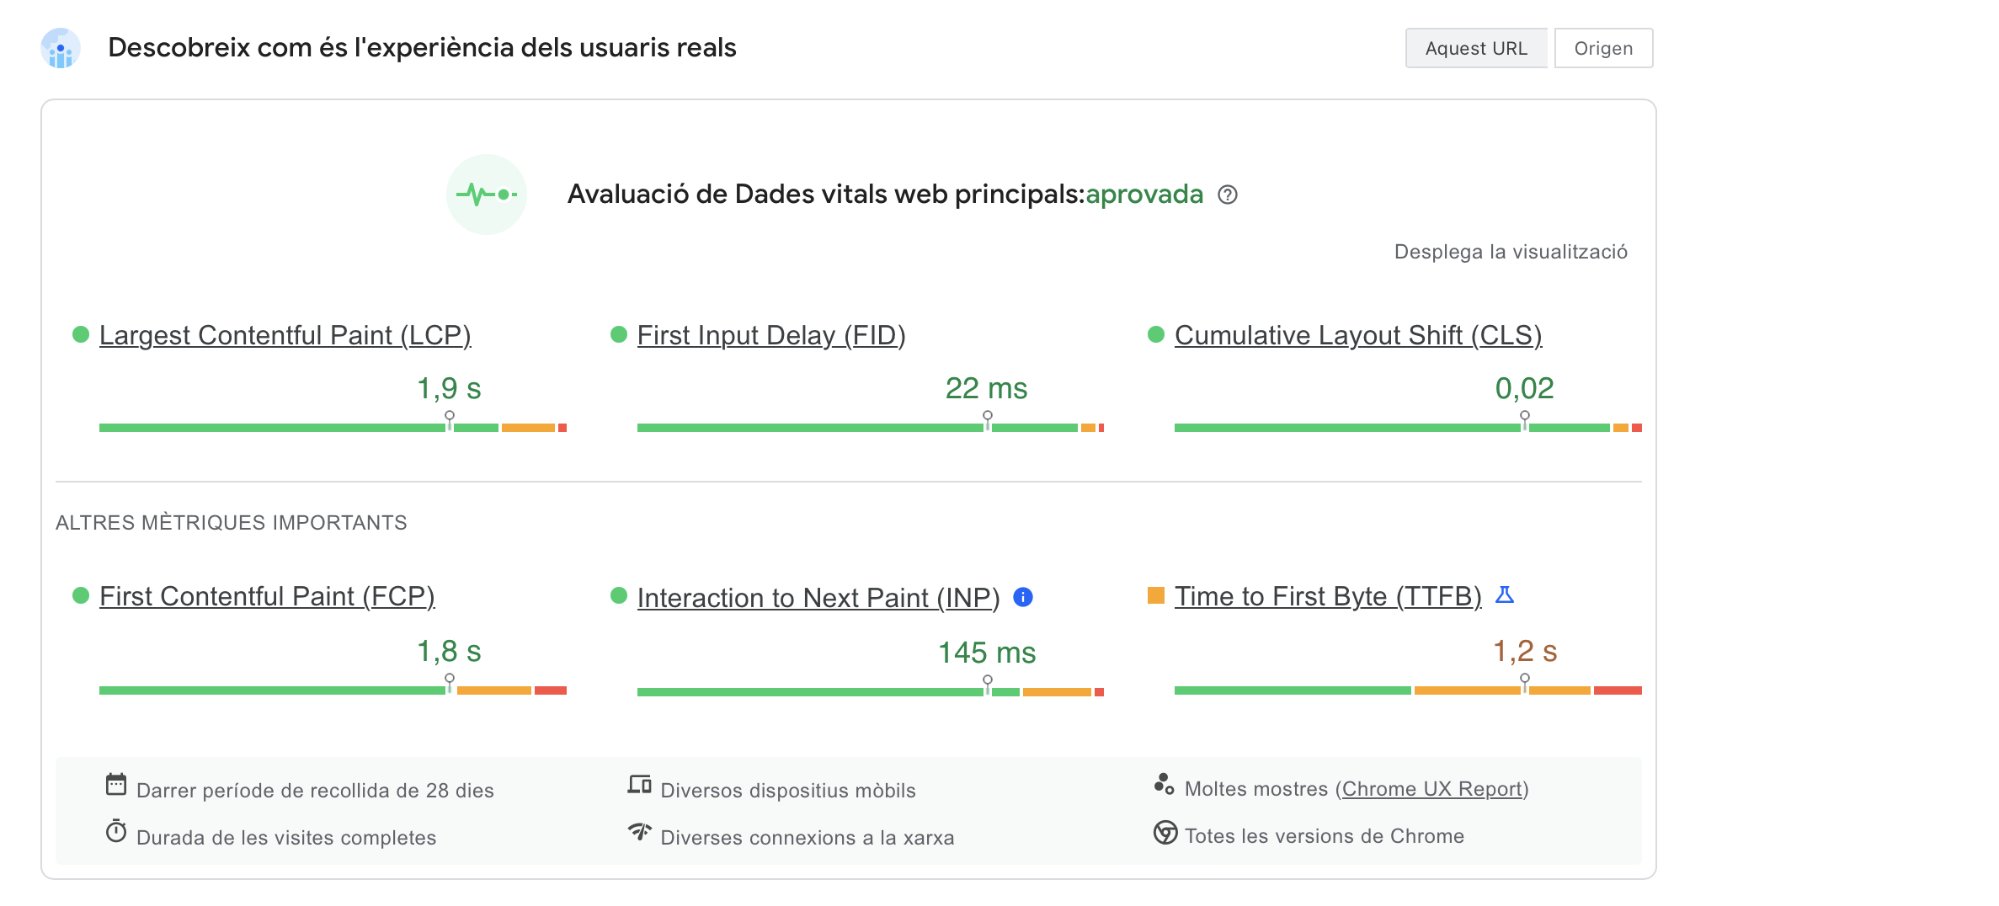
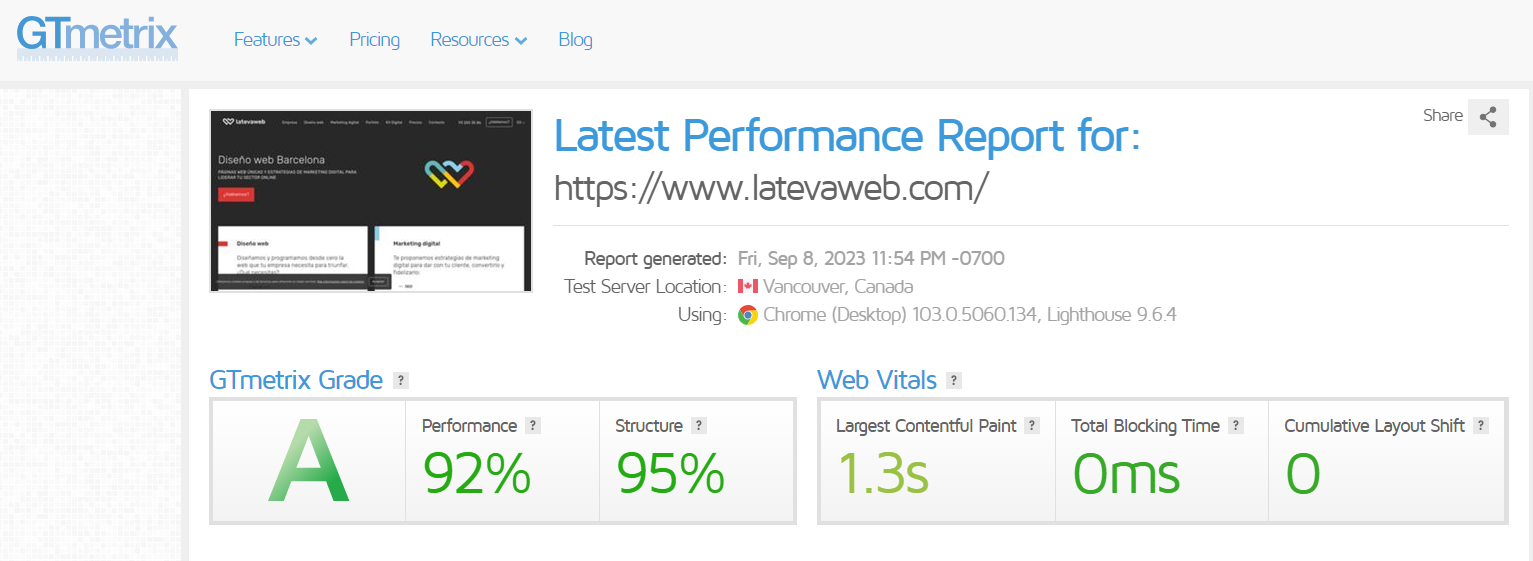
4.3. GTMetrix
A very complete tool, for many people more useful and reliable than Google’s. GTMetrix, in addition to giving us a score and some colors, provides interesting information about the waterfall and some tips that you would do well to follow.
4.4. Web Page Test
This is an interesting alternative to the previous tools. Web Page Test, in addition to a general speed test configurable with various countries, connections and devices, offers an interesting Core Web Vitals report and another one that we see as very promising to control the carbon emissions of our site.
4.5. Dot Com Tools
This WPO analyzer is especially interesting for international projects. Dot Com Tools gives you a performance audit simultaneously from different points around the globe, and is the main ally when hiring a CDN properly.
4.6. Built With
This and other tools can be useful for getting to know the inner workings of the website. Built With gives us information about the CMS used, the server hosting the site, the front-end and back-end components, etc. It allows us to get an idea of the internal ecosystem and the room for improvement we may have.
4.7. Wappalizer
It provides practically the same functionality as the previous tool, but in this case as a Chrome extension.
4.8. Request Map
This tool is useful for visually seeing how external requests are made, which is always a major headache. Try Request Map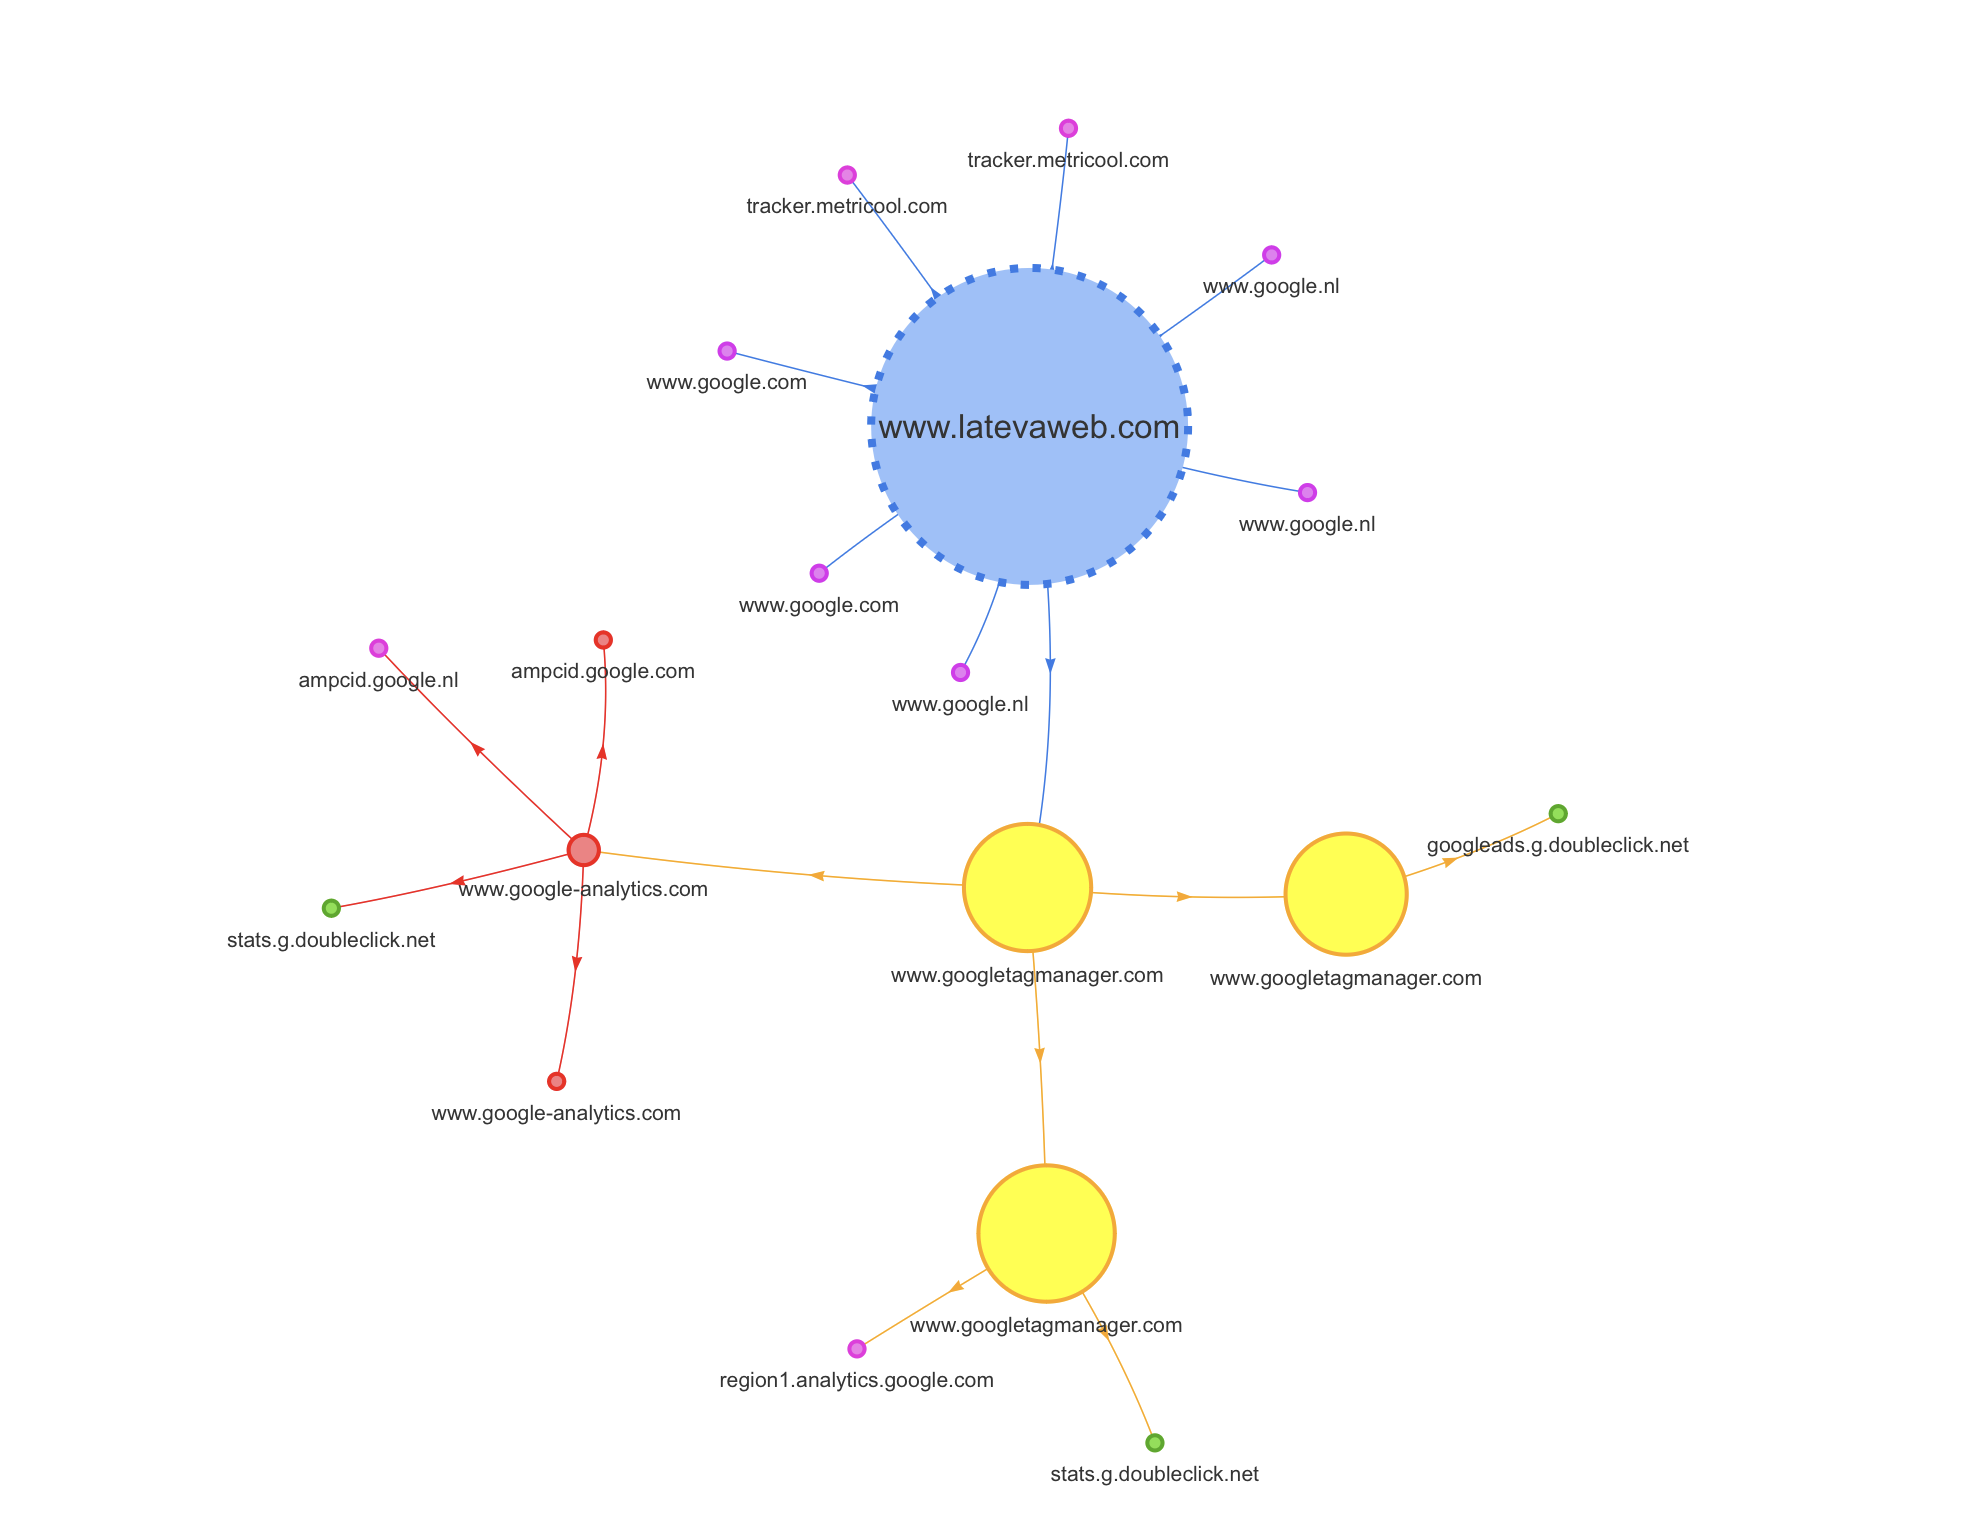
5. The guts of a WPO audit
The WPO audit has two areas of analysis: on the one hand the server environment, and on the other the website itself. We recommend starting with servers, although it is not mandatory.
5.1 Server audit
At server level we must analyze:
- Https protocol + TLS version
- Type of server
- PHP version
- HTTP protocol (1.1, 2 or 3)
- Databases (MariaDB, MySQL)
- Storage (SSD)
- TTFB (not always 100% due to the server)
Https protocol + TLS version
Using Chrome Dev, we can obtain some basic security information:
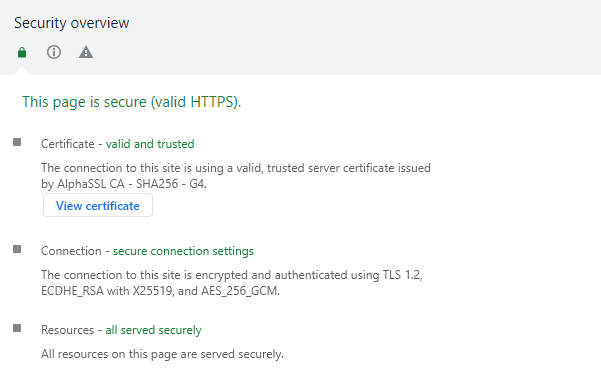
Here we should check:
- That we have an SSL certificate, that it is valid and trusted, and that it is not expired.
- Connection (TLS, QUIC). In principle, the latter is better for complex projects. In the example you see we use TLS 1.2, so one improvement to propose would be to move to TLS 1.3, since switching to QUIC would be quite unrealistic. Learn more about the differences between TLS 1.2 and 1.3.
- Making sure that resources are loaded securely.
Type of server
There are many types of servers, although the most common are Apache, Nginx and LiteSpeed.
We can check ours with the Wappalyzer extension, for example: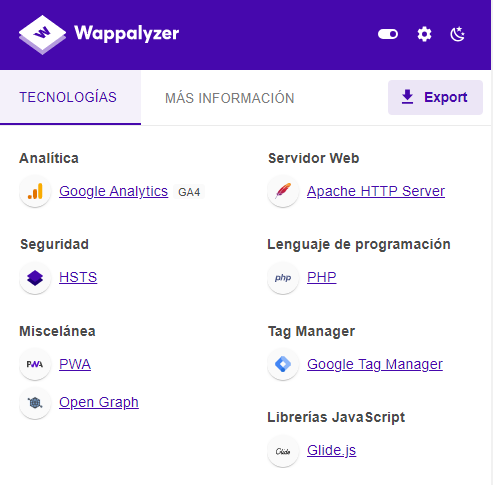
In our example case it is an Apache server. Sometimes it is not visible with Wappalyzer; an alternative would be the Chrome Web Developer extension.
PHP version
We are also interested in knowing the PHP version we are using. This is something that is usually impossible to know if we do not have access to the hosting and code, although sometimes it is visible from the header response in the inspection tool and in GSC URLs. In our case this is not so, so we asked our hosting provider.
The more recent the PHP version, the better. Especially if we can move to version 8, since all requests are processed much faster (see the comparison of PHP versions). However, you must bear in mind that you cannot just upgrade the PHP version blindly, because it may be incompatible with the website’s code and leave you without a site in seconds. So first you must make sure that the code is ready or has been adapted to that change, and bear in mind that some projects, due to their age or the way they are built, will not withstand a major PHP upgrade without breaking.
HTTP protocol
There are several protocols, and they greatly influence the ability to process data packets simultaneously (see the comparison HTTP1 VS 2 VS 3 protocol). The more advanced the connection, the more data packets can be processed in parallel.
With this in mind, let’s see which connection our site uses. To do this we can use Chrome => developer tools => network => right click => protocol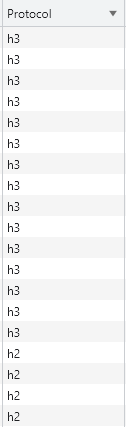
In our case we see that most of the content is delivered over h3, but some elements appear in h2. In these cases, you must check whether these elements are served internally from our site or are external. In the latter case we obviously have no room for improvement. In any case, it is important that nothing is delivered over HTTP1 anymore, and the more we can serve over HTTP3, the better.
Databases
All websites need a database to store content and records, and good storage and processing of information speeds up requests and, consequently, website performance. The most common systems are MySQL and MariaDB. In principle, MariaDB is better, especially for large databases (see the comparison MySQL vs MariaDB). Knowing the database type of a project is difficult from the outside; you must check your hosting control panel or ask your provider.
Storage technology
Our website is stored on hard drives, and their quality and capacity are key. The most common systems are HDD and SSD. The difference in write, delete and request speed is huge. If you are not using SSD yet, it is something very interesting to consider. Again, this is information you must check in your hosting control panel.
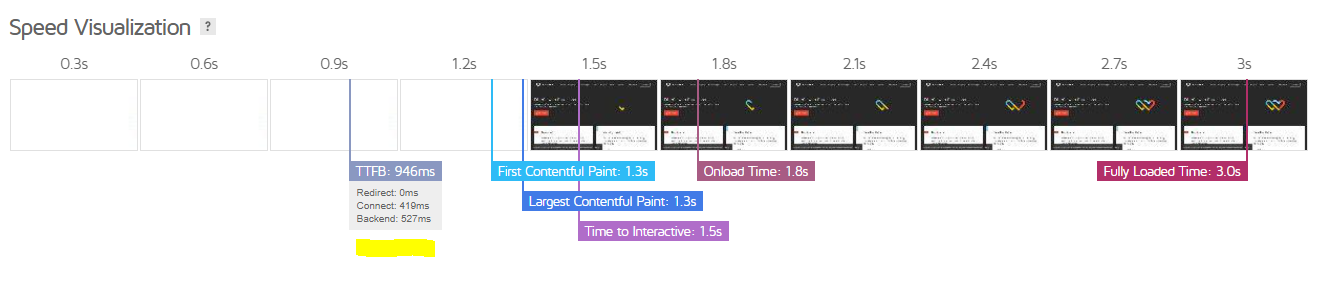
TTFB
It measures the time from a request for website content until the first byte of data is received. The commonly known response time.
It can be analyzed with several tools; in this case a good option is Speed Vitals.
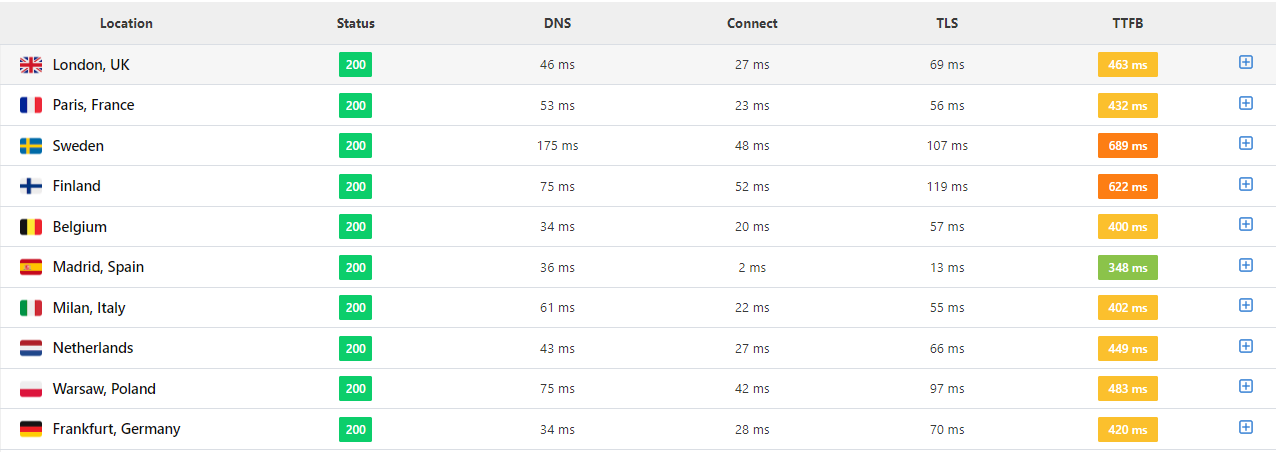
This tool is very intuitive, fast, and gives you TTFB from several countries. The example you see is very clear: TTFB is fine from Madrid but not from abroad. This is where business considerations come in: if it is a website and a business focused on a local or national audience, there is no problem. But if it aims to attract users and/or clients from several countries, this would be a key point to improve.
An interesting local alternative is to use Chrome Dev, but you must be very careful, because you should configure the network and devices that Google uses for its Speed Test, as your own network will likely be faster.
GTmetrix would also be a very valid option, although the fact that its analyses are run from Canada can often distort the figures:
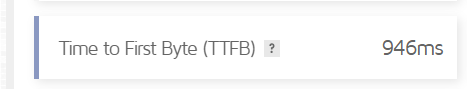
With this and other metrics you will see that, depending on the tool chosen, the values differ. That’s why it is important to become familiar with them and, whenever you make comparisons, use the same tool and configuration.
Measures to take on servers
All the points mentioned above must be analyzed. However, in some cases, if we already have a good enough option, it may not be worth changing to the perfect one if the resources and risks do not justify it. It is especially advisable to update the PHP version if possible, but for example changing the database technology will usually not be worth it, since a small performance gain would require a lot of development and cost.
Migrating to a new hosting provider is always laborious and delicate. If the initial assessment is not disastrous, explore options to get more out of your current hosting. Only if this is not possible should you consider migrating to another hosting.
In the second part, at website project level, we must analyze:
- Number of requests per page type (pages, posts, tag…)
- Internal resources (CSS, JS, IMG, PDFs…)
- DOM complexity
- CSS and JS complexity
- Fonts used (3 or 4 should be enough; many sites load more fonts than they actually use)
- Caching
- CDN
In this section we will review configuration aspects of our website that are impacting performance and that have room for improvement.
We will run a tool, whichever we like most, and it will output some recommendations.
If you use a CMS such as WordPress or Prestashop, our recommendation is that before you tackle this, you carry out a plugin/module audit. You should do the following:
- Remove plugins that are not being used. It is not enough to deactivate them; they must be completely removed. Google warns us of this in its own test:

- All active plugins should be updated, as they will affect many aspects, including performance. Needless to say, to update them we will need valid licenses, and you should not be stingy about this. This also applies to the theme, if you are using one.
- Optimize all the plugins that you have. For WPO, you should choose the ones you like most to optimize compression, rendering and so on. Everyone has their own favorites: WP Rocket is a good option but not the only one, so test different ones.
- Font optimization: to save on external calls, it is important to load fonts locally instead of from external sources like Google Fonts. If you use WordPress, there are plugins such as OMGF that can help you.
We then run a new Page Speed test. Some of the most common errors you will find are:
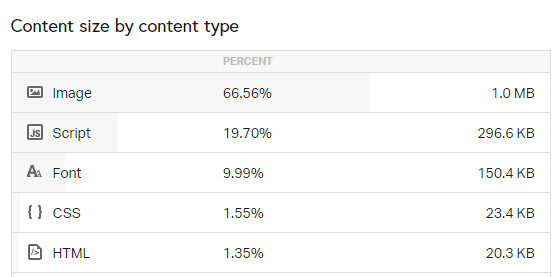
- Images that are too large: in those cases you should compress them to the minimum viable size, without harming the optimal display of the site content. This process can be done manually, but the best is to do it in bulk using scripts or, in the case of WordPress, with a plugin like Imagify. You should bear in mind that you need to optimize the images currently on the site, but you must also plan what will happen with future ones (you will need routines or strict guidelines for whoever uploads content so that new images are uploaded properly).
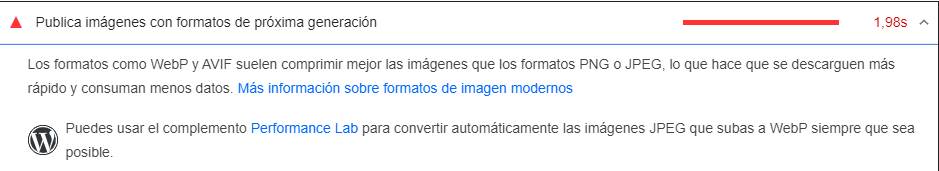
- Use next-gen image formats: the key here is to serve images primarily in WebP format, which is the format Google asks for, while keeping the original JPG or similar versions.
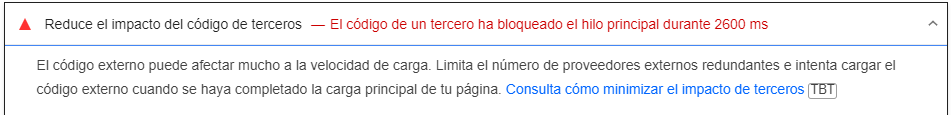
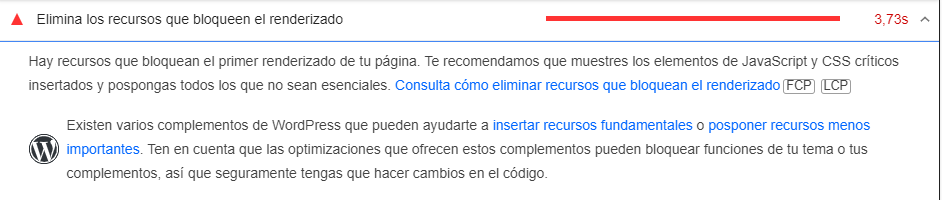
- Eliminate render-blocking resources: here it is essential to load upfront the JS and CSS that we need for the first view of the content at the top of the page, while the rest can be loaded later (defer, async).
- Defer loading of off-screen images: the same approach we applied to JS and CSS files should be applied to images. This way, as the user scrolls down, images will be loaded progressively instead of loading them all at once at the beginning.

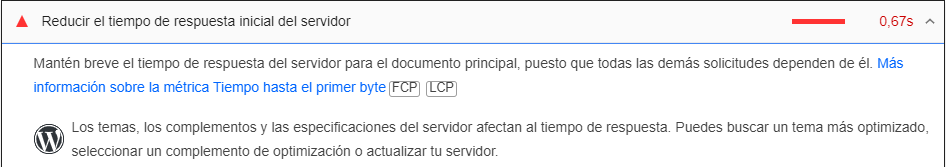
- Reduce server response time: this message should disappear if we have addressed the previous section of the article dealing with server adjustments. If that is not properly resolved, the rest of the actions we take will matter little.
Real-world test:
6. Summary and final thoughts
Don’t obsess over your Page Speed Insights score. Remember it is a very extreme test, due to the device and network used. Sometimes a project simply cannot reach the “green zone” because of its nature; the idea is to get the most out of it with reasonable resources. Pay special attention to whether you are meeting the standards required by Google in the main Core Web Vitals metrics.
At server level, we have already mentioned that a drastic change is not simple and sometimes will be impossible. At least consider the possibility of updating the PHP version, and for new projects or migrations, then yes, plan for a best-case scenario.
On the other hand, at website project level, the most important optimizations are all those related to images (compression, using the actual size you need, using next-generation formats such as WebP), as well as everything related to JS and CSS processing (compression, internal/external loading, deferred and asynchronous loading).
Use Google Search Console and the CruX report in Locker Studio to monitor the performance experienced by the real users of your website. You should balance your efforts with the actual type of users your project has (countries, devices, etc.), or those it aims to have in the future.
About the author
Bruno Díaz — Marketing Manager
Professional with a long career as a communication and digital marketing consultant, specializing in SEO, SEM and web projects. As Marketing Manager of the agency, I coordinate a great team of digital marketing technicians of which I am very proud.
Related news

Hello! drop us a line
Having a fast and mobile-friendly website is no longer optional.