
Francesc Sánchez


Google Search Console is the only official, reliable and free SEO tool. In this post you will find all the keys you need to navigate the tool, as well as the best tips from our SEO specialists that you may not know yet.
Very often, when we get started with SEO we rush to try several external tools and forget that we can get a huge amount of value from the best one of all. Let’s take a look:
It is a free tool provided by Google that helps us understand how our website is crawled, indexed and ranked in the search engine. It is the most powerful SEO tool and it is free. Google Search Console (GSC, formerly Google Webmaster Tools), besides analysing our site, gives us improvement recommendations. It will always be more reliable than any third-party external tool.
The tool only works for verified site owners, which means your competitors will never be able to use it to spy on your SEO data. You must sign up here https://search.google.com/search-console/about and verify your property using different methods, but all of them require access to the site’s domain, hosting or CMS. After verification, the data is pulled from Google’s servers into the interface.
Regarding the data you will see in GSC, keep in mind:
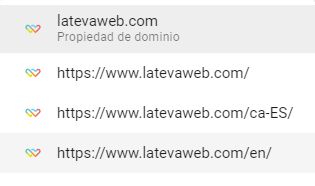
Basically there are two types of properties in GSC: domain properties and URL-prefix properties.

In the first case, we verify all protocol versions of a domain and its subdomains. This is the most interesting option, but we will not always have permissions to do it (essentially, access to the domain). It is especially recommended for large projects working with different subdomains and protocols. If we use a single domain and all versions are redirected to one protocol variant (for example https://), a URL-prefix property for that exact URL will be enough.
tip: if you work with a domain that has separate language folders (for example example.com, example.com/es and example.com/en), register them separately so that you can analyse their rankings in a segmented way.
In the past it was recommended to also register the version without www or without https, but if you already have everything correctly redirected (double-check it), it is no longer necessary.
Once your property is verified, here are some configuration tips that will help you get the most out of it:

We include this section with the caveat that the menu changes constantly, so we will focus on the main items:
Next we will look in more detail at some of the most important internal reports and tools:
In the short term, this is our main scoreboard, because it tells us what we are actually ranking for, and it is our best proof of results for the client (assuming the numbers are good).
By default, it shows the evolution of SEO clicks over the last months, but if we click “Full report” we get into the heart of Search Console: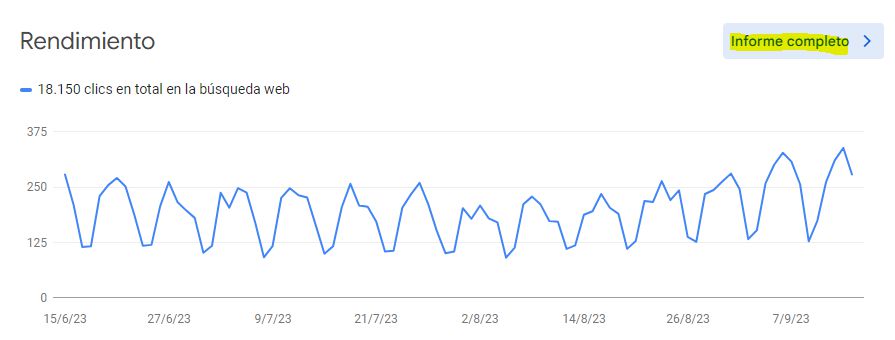
hint: looking at the previous example, you might think this site has stable traffic. Nothing could be further from the truth: this project is in good health and is actually growing. What happens is that it is a B2B website and, as a result, traffic drops sharply at weekends. All B2B projects should have a similar pattern; if they do not, it is a sign that something is off.
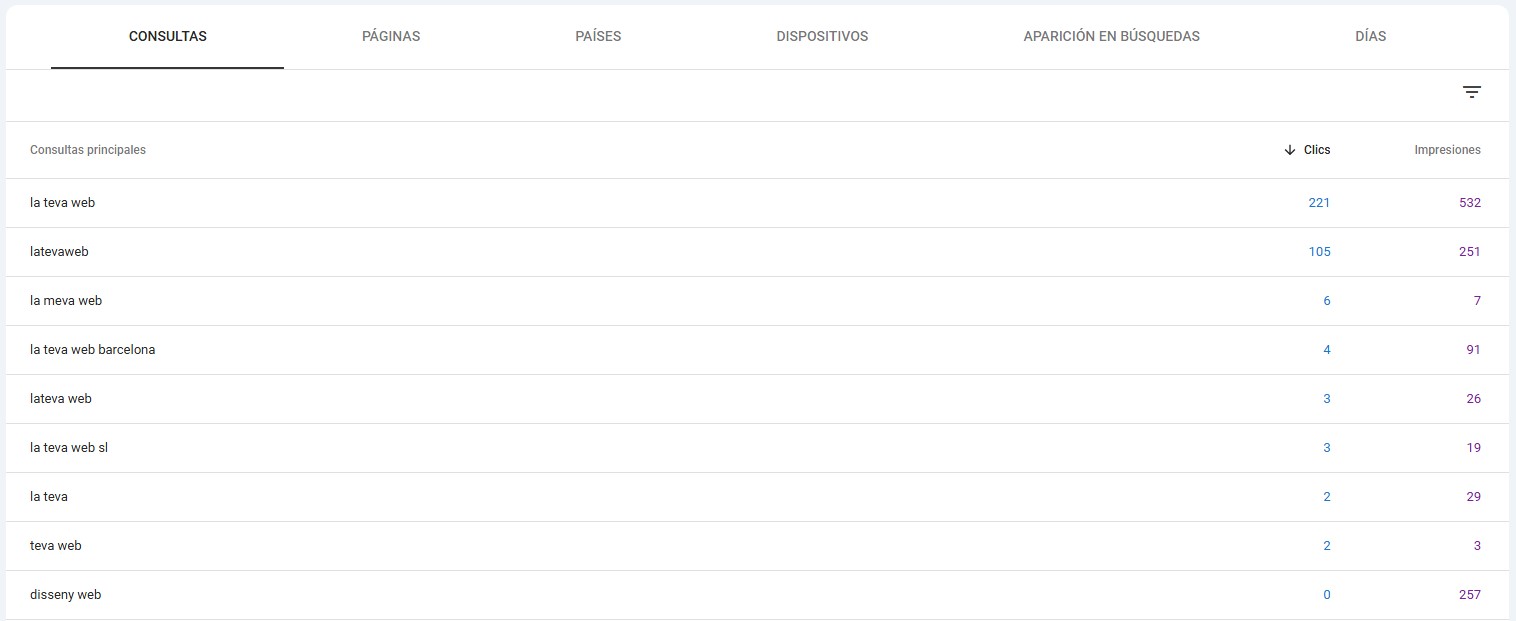
Once you are inside the report, you will find: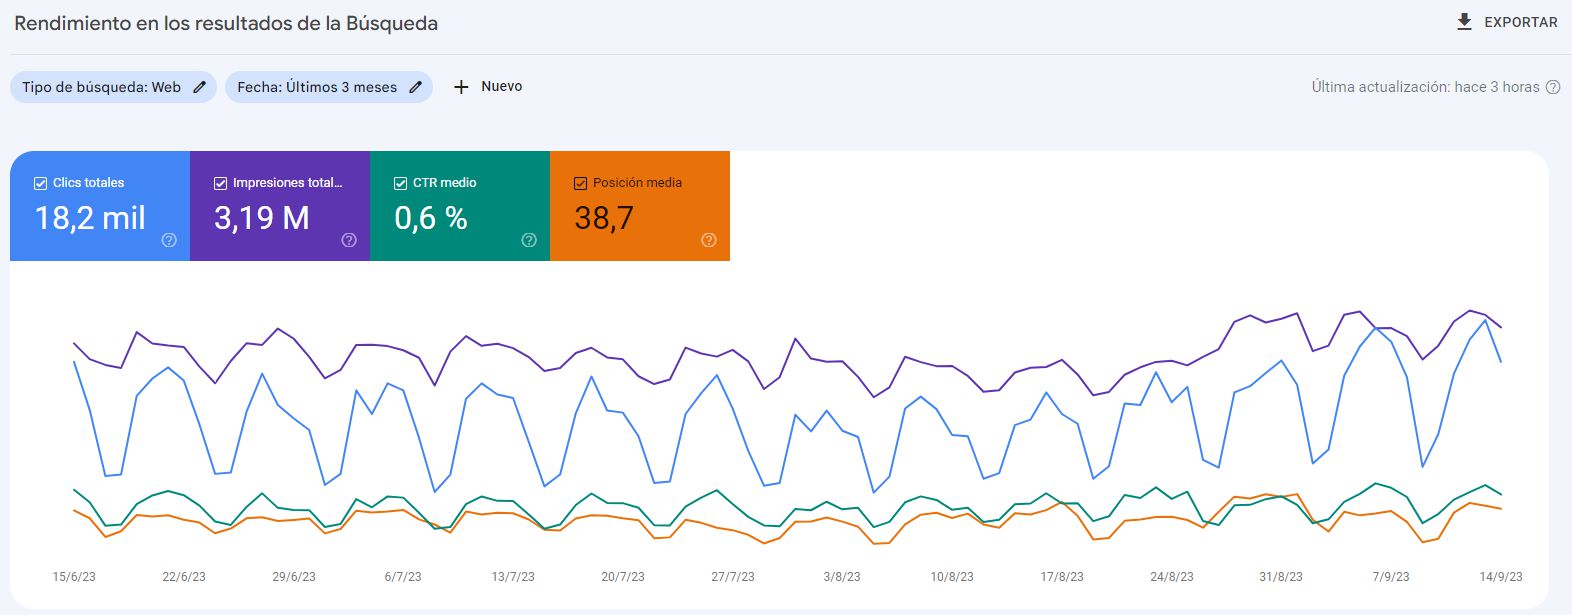
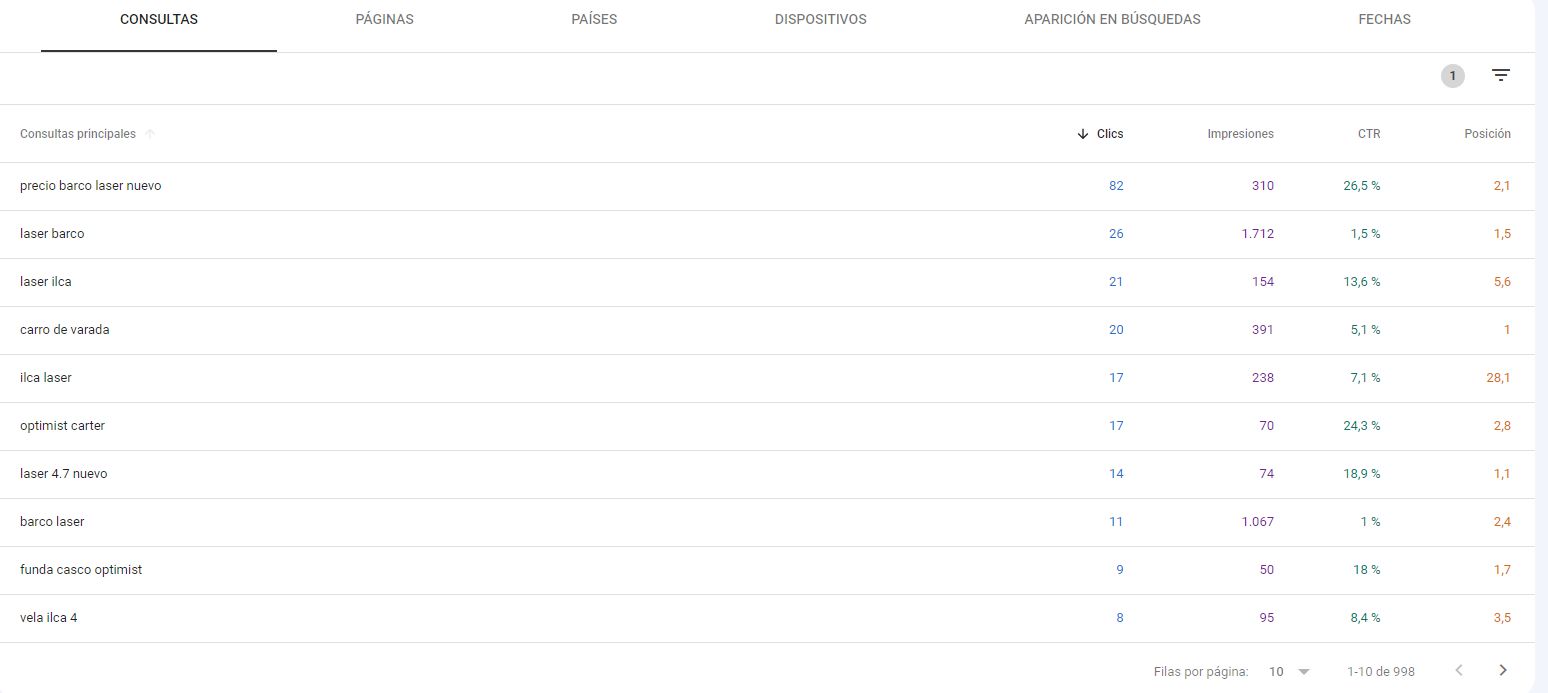
At the bottom we have the queries table. By default we see the queries that bring the most SEO traffic, but from there you should explore and play with filters. This will let you analyse the performance of keywords you already had on your radar, but you will also find unexpected SEO opportunities. Pay special attention to keywords with many impressions but few clicks: there is an opportunity here, because improving your average position could capture more traffic.
The secondary tabs allow you to view, filter or cross data using different dimensions: landing pages, countries, devices and more. In 2025, Google introduced improvements in how filters and navigation between reports work. Now, filters applied to one report remain active when you switch to another, and there is a button to reset all filters with a single click.
Depending on the type of site and content you offer, in Performance you may also see additional tabs to analyse how you appear in Google News or Discover, which is especially important for publishers and media. They follow the same structure and philosophy as the main report:

If we want to know what Google thinks of a specific URL on our site, we need to paste it into the main search bar at the top, which is increasingly prominent from a UX standpoint:
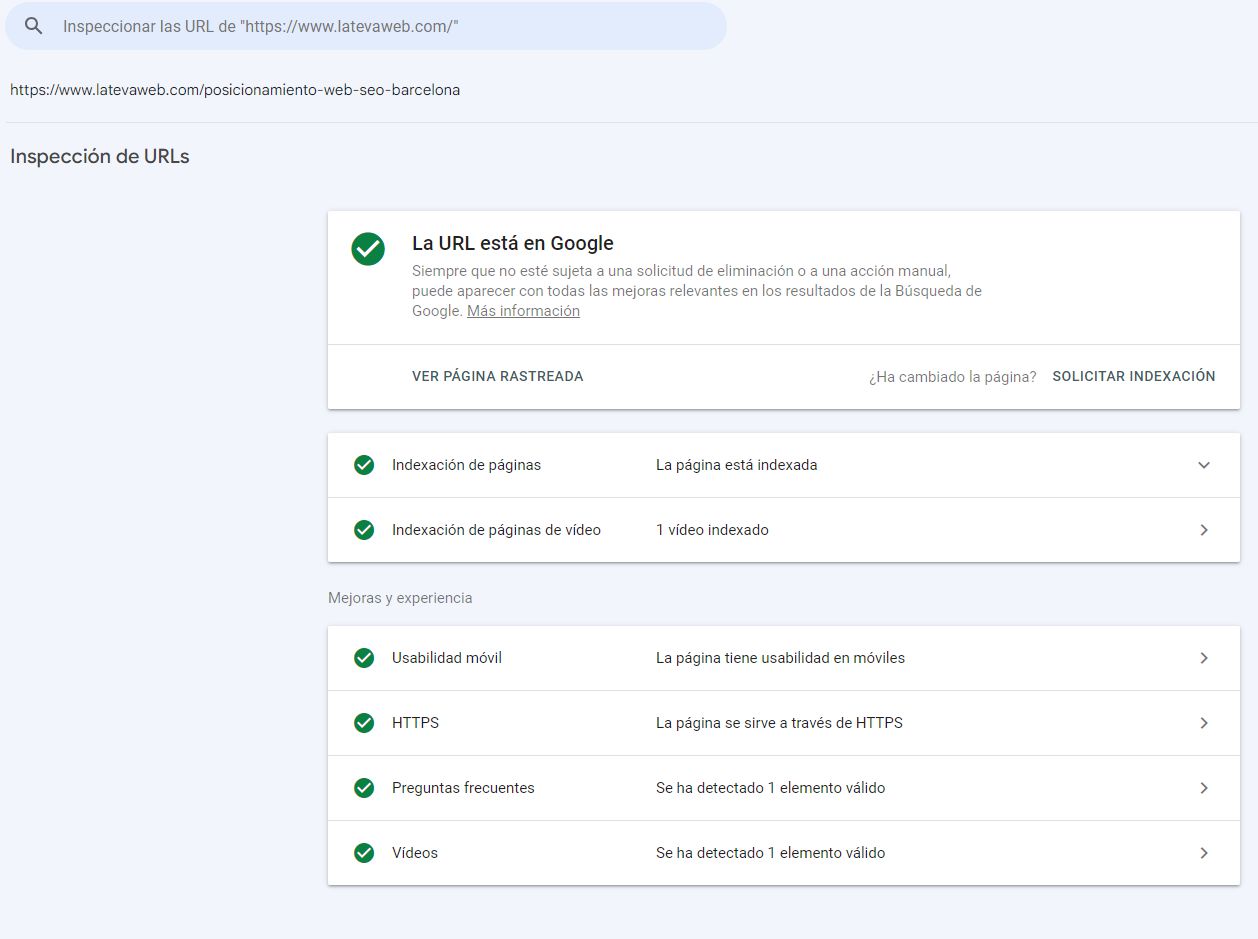
Let’s illustrate this with an example from our own site. We get the following information:
In the URL inspection report we can click on “View tested page” and analyse what Google sees both at code level and visually. This is especially useful for websites that rely heavily on JavaScript.
This is a tool that originally lived outside the main Search Console interface but has been gaining importance and is now integrated. In the Overview you will see a prominent link to it.
To use it, you must have GSC and Analytics linked. What does it do? Essentially, it shows data that we could obtain from the Performance section but only after a fair amount of filtering and digging. Search Console Insights instead gives us these pre-digested, easy-to-read reports.
This tool helps us identify the content that has been performing best organically over the last 3 months: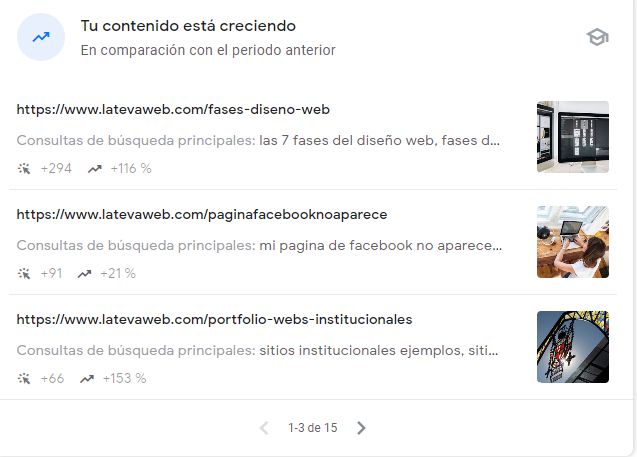
In 2026 the tool improved significantly and now offers a different angle and more data that can help us: the main improvement is that previously it only showed what was going well, while now it also highlights what is going wrong: pages and keywords that are losing traffic, turning it into a very interesting SEO alert system.
Now you can specifically filter and analyze branded queries separately from generic ones. This allows you to:
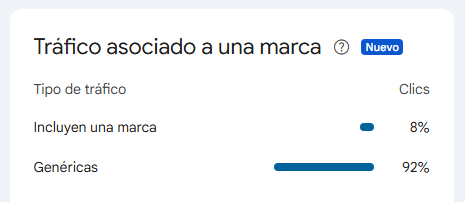
Google automatically groups queries by thematic categories, making it easier to:
These features make the Statistics tool even more useful for strategic decision-making in your SEO content strategy.
People who approach SEO only from a business and content perspective could stop here and not go any further. We already have a sense of the countries, topics and URLs we are ranking for and can gather ideas for future content actions. But if you want to go deeper, let’s continue.
In the index coverage reports we see information about how Google discovers, crawls and indexes (or doesn’t index) our pages. There are several sub-sections.
This report shows the total number of pages Google knows about and how many of them it has actually indexed (in green).
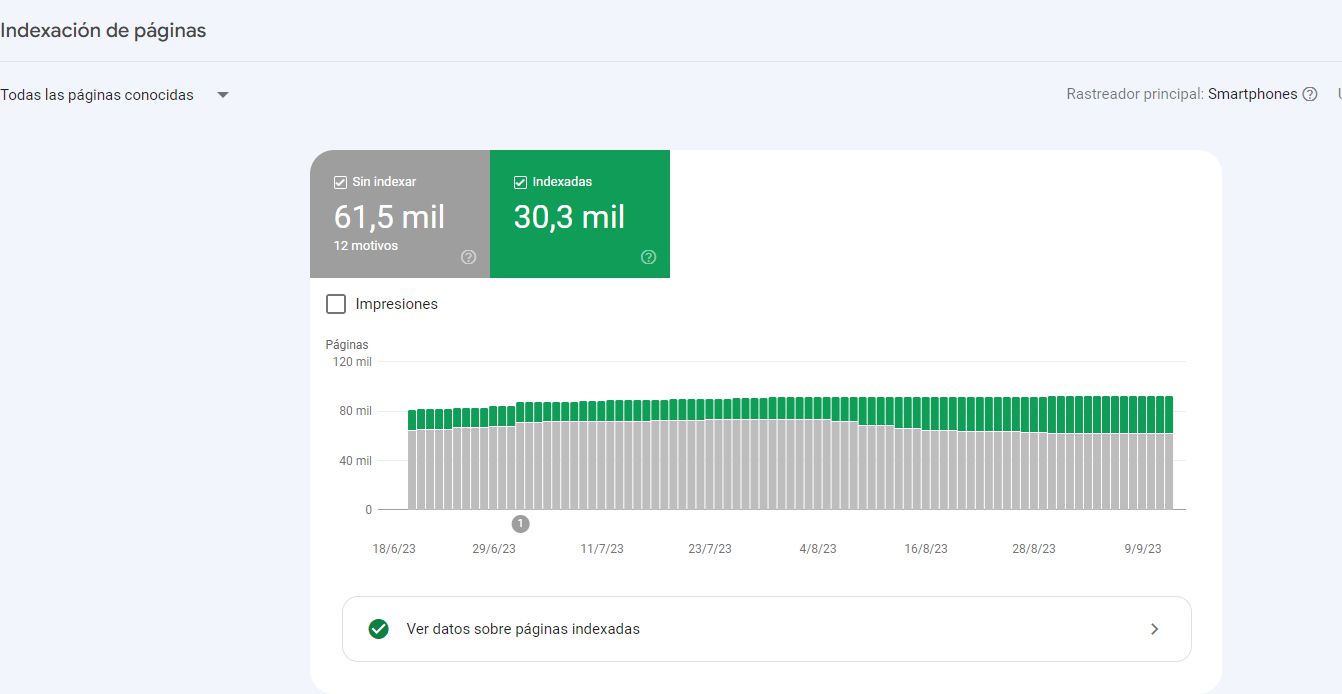
Look at the chart above: this project has more than 90,000 URLs, but Google has only indexed 30,000, around a third. Is that good or bad? It depends, because we do not know which URLs we really wanted to rank, and we may have many combination or filter URLs that are correctly configured not to be indexed.
In other posts we have explained what a sitemap is and what it should contain. Assuming the sitemap is correctly implemented and includes all the URLs you want to rank, apply that filter:
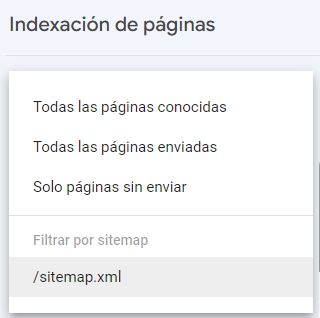
We get something like this:
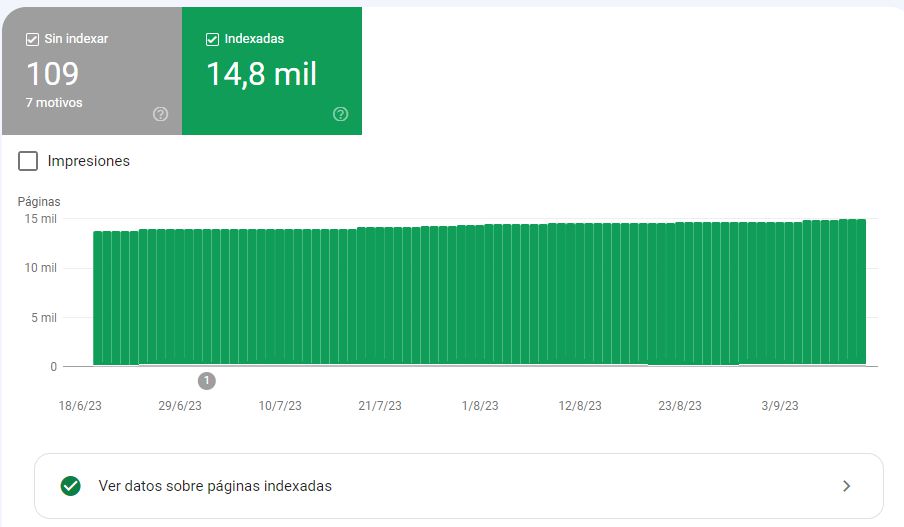
It turns out that through the sitemaps I am sending roughly 15,000 pages, but twice as many end up indexed. What happened? We can obtain the inverse report, “Only not submitted pages”. In our case these are URLs with paginations, parameters and other variations that are not in the sitemap but are being indexed. We will need to take action through internal linking, canonicals or robots.
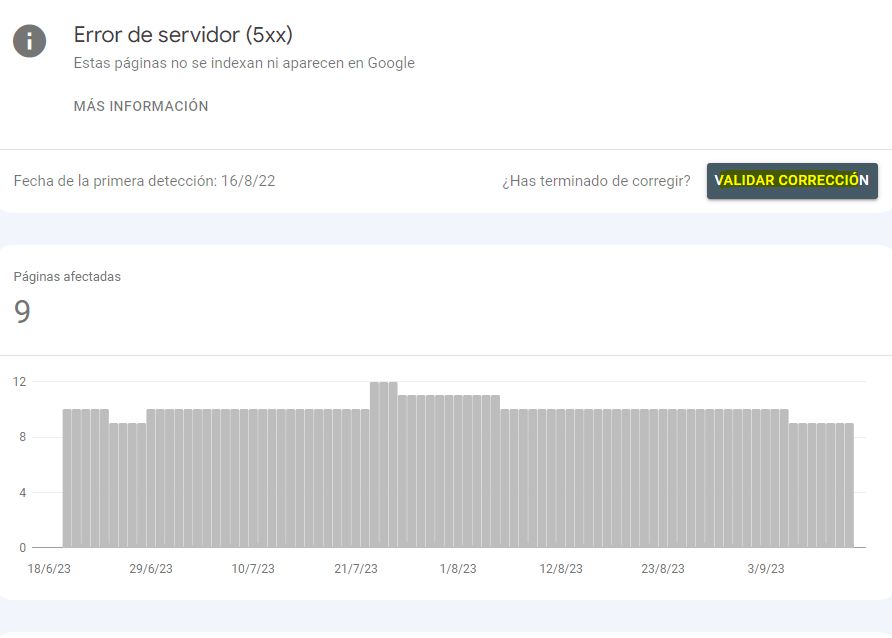
Why are there pages that are not indexed? There can be many reasons and, in most cases, it is perfectly fine for them to remain unindexed.
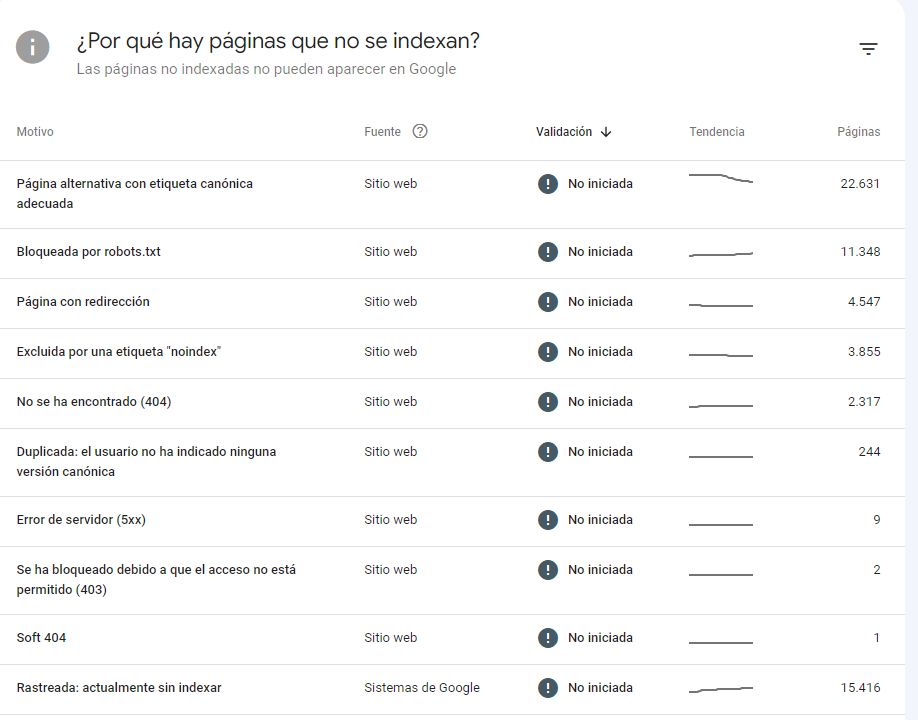
In each case Google shows you the reason, the trend and how many pages are affected. Once you have identified and fixed a specific issue type, you can ask Google to validate the fix:
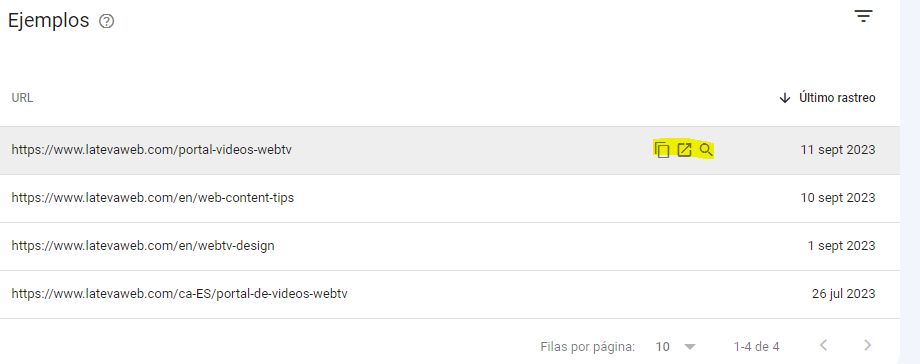
Once we are looking at a list, it is a good idea to analyse a sample of URLs. For each page we know its URL, when it was last crawled, and we have the option to open the page or inspect the URL, where we will generally find the explanation:
Below is a summary of some of the most common issues you may encounter. The current format can be a bit confusing, especially when clients look at it, because genuine errors appear side by side with things that are not errors or are not always critical:
If you want to go deeper into these topics, check our post “How to fix 5xx and 4xx errors thanks to Google Search Console”
This second index report only appears if you have embedded videos on your site. It shows the list of videos detected by Google on your site and which of them are indexed:
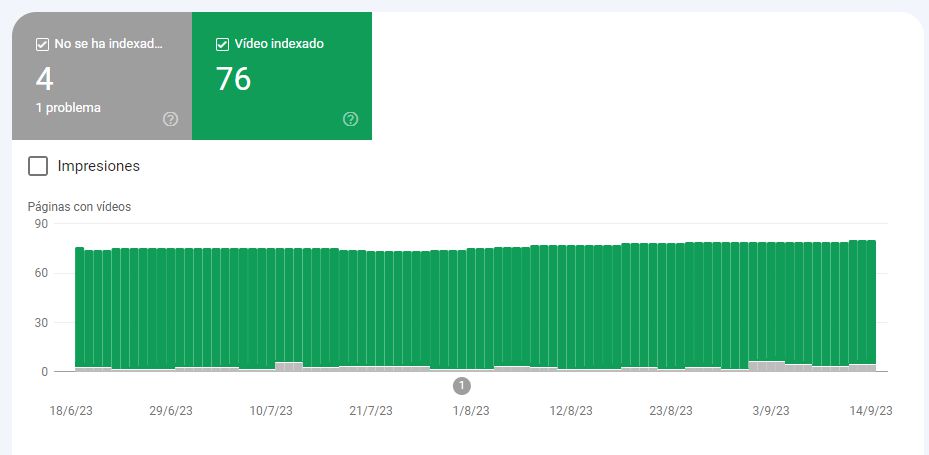
Only videos on indexed pages are considered. In our example, Google has detected 80 videos but has indexed only 76. Note: it will only consider indexing a video if it is important within the page content, not if it is just a side element. And if there is more than one video, it will only consider the first. You will see the reason for non-indexing in GSC:
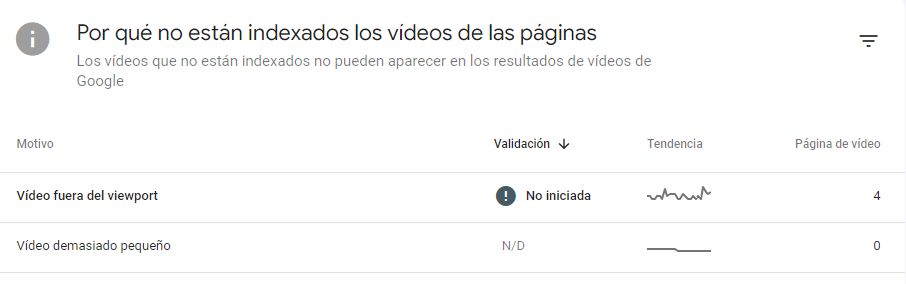
The most common issue is “Video outside the viewport”. If you want the video to be indexed, you should move it higher on the page so it becomes more prominent.
This is one of the most important sections, especially for large sites. Submitting your sitemaps should be one of the very first steps when setting up a new GSC property. From this tab we can submit sitemaps to Google, check that they are processed correctly and, after a few days, start seeing data related to the URLs included in them.
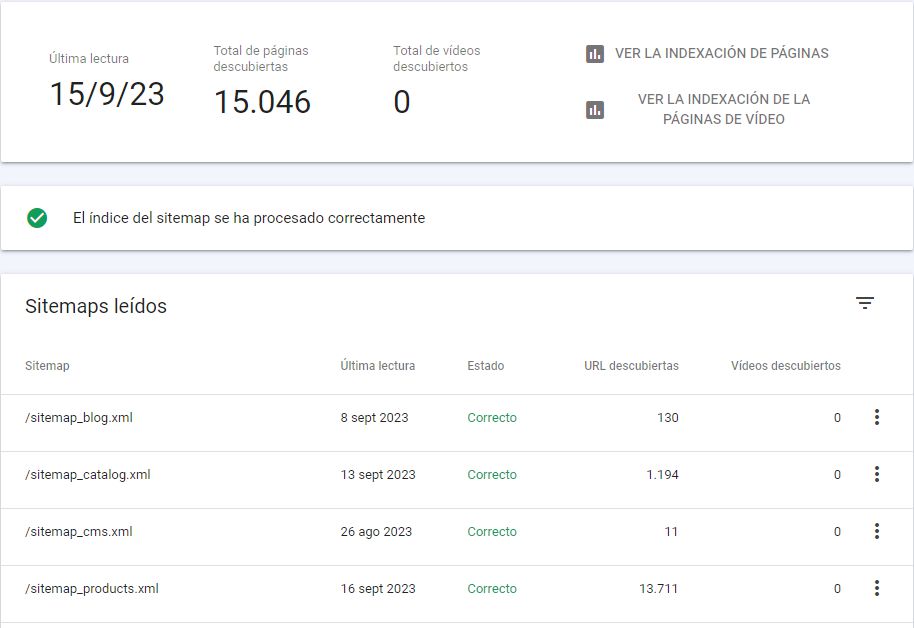
This report provides useful information:
If we click “View page indexing” we see indexation data related only to the URLs included in that sitemap.
tip: whenever the technology allows it, it is a good idea to split sitemaps based on the type of content, as we show in the example. And if your site is multilingual, it is ideal to separate them by language or language-country combinations, so you can analyse performance by segment.
This tab requires advanced knowledge, because it is very delicate. Misuse can wipe out an entire website from Google. It is the section most often used when the site has been hacked with injected spam URLs, for instance. You should only use it in extreme cases, when you have URLs that are causing serious problems (for example copyright issues or malicious content).
The tool lets you remove a specific URL or groups of URLs that share a prefix (for example, web.com/blog):
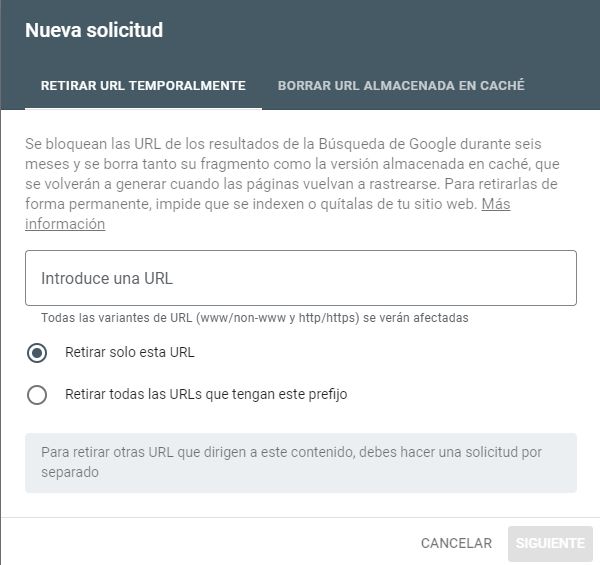
The “Clear cached URL” tab is for URLs that you do not want to remove entirely, but where there is an error that you want to fix (for example a big spelling mistake or a wrong price). Google will remove the last cached version and, when it crawls the URL again, it will pick up the updated content.
To the right you will see the “Outdated content” tab. If a page or image is no longer available on your site but is still appearing on the SERP, or if it has been updated and Google is still showing the old version, you can request that it be refreshed. If the request is approved, the image or page will be removed from Google (if it no longer exists) or the search result will be updated (if it has changed).
Finally, the “SafeSearch filtering” tab is used to tell Google when content is intended for adults.
tip: keep in mind that removals are temporary. If we do not also take action on the site itself (delete content, change response codes, block with robots.txt, etc.), these URLs will eventually reappear and we will be reliving Groundhog Day.

These reports used to be among the most visited by technical SEOs and clients, and they created many problems and misunderstandings. The intention was good (to evaluate mobile usability and performance on both mobile and desktop), but their use and misuse led to a lot of confusion. For that reason, Google has announced various changes, and we will just summarise.
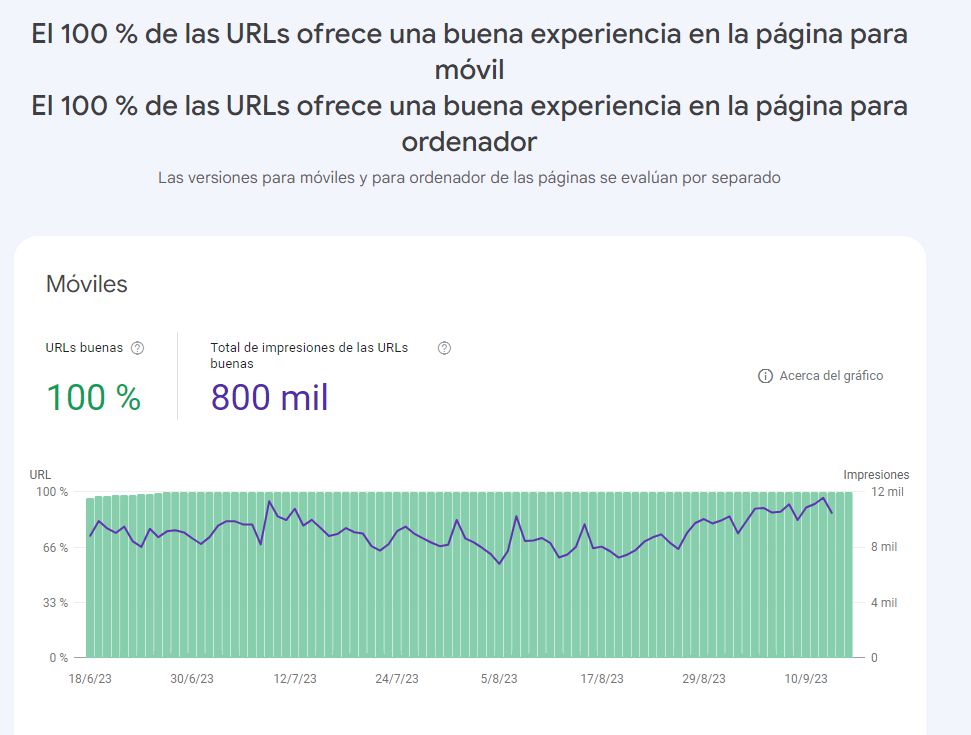
The ideal scenario is to have all three main experience reports in green (your site is mobile-friendly, passes Core Web Vitals, and user experience is good across all URLs on both desktop and mobile). Unfortunately, this will not always be possible and you should weigh the cost of improvement against the benefit. In any case, this is somewhat outside pure SEO and should be handled via a dedicated WPO audit.
In the article linked above you can see where Google is taking these reports:
Overall, there will be far less page experience information in Search Console and only the most serious issues will surface. If you want to work on these aspects, you will have to rely on other tools such as Lighthouse.
These reports should only appear on GSC properties for e-commerce sites. If you do not run an online store and still see them, it is likely a mistake. If you do have an e-commerce, this section is extremely important. In the past, most of the relevant information about products in Google was found in Google Merchant Center. While that is still a very useful tool, Google is gradually providing more insights directly in GSC.
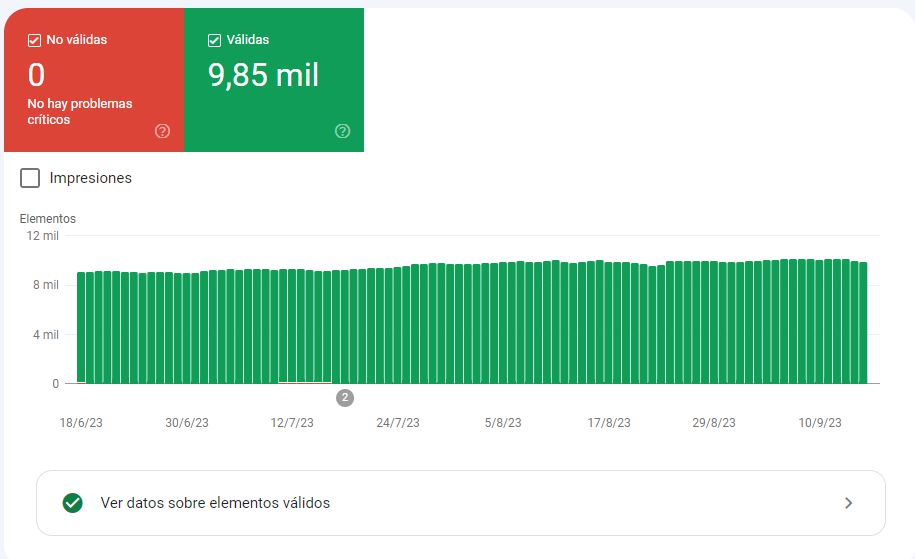
In this view we can see the products Google has detected and how many it considers valid and therefore eligible to appear in Google. It is important to mark up products correctly according to Schema guidelines in your structured data, but also to send them via a product feed in Merchant Center. That way we give Google the full list of products with their URLs, images, stock, brand and so on. With this markup, our products can appear as rich results in classic blue links, but also in Images and Google Shopping, Lens or YouTube, among others.
If Google does not receive the essential information properly, those issues will be flagged in red and you should fix them urgently. Once that is done, you will see a list of enhancements. These appear in yellow and are not strictly required, but they are the sort of details Google appreciates in order to understand your product better and ultimately rank it more effectively:
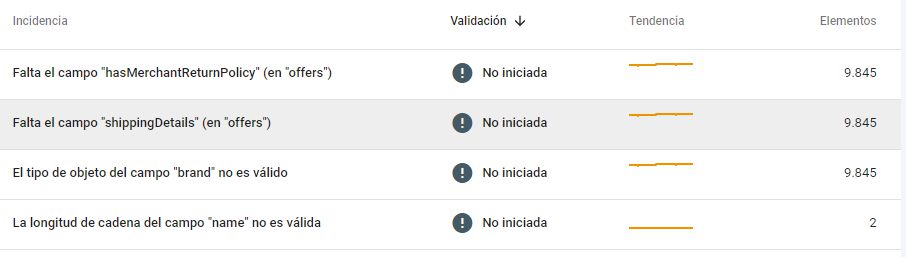
In the example, Google recommends that we provide information about shipping policies, return policies, and that we specify the brand for many products that currently have none, among other things.
This report can contain several tabs related to the content of our site, essentially linked to structured data markup. These are some of the most common ones:
Hidden inside the Settings section (still a strange choice), there is a real gem. It provides a kind of log report of how Google’s bots have interacted with our site over the last 90 days.
Some key parts:
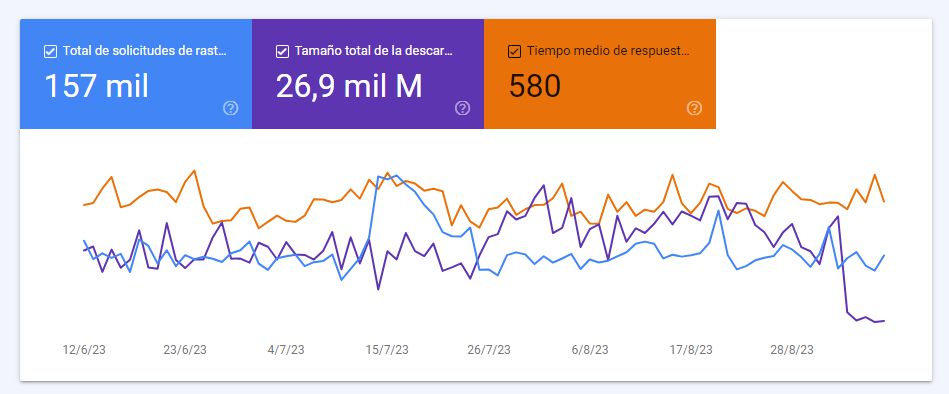
We can see how many crawl requests our site receives, the total amount of downloaded content and the average response time of the server. Any optimisation we do at server level will have a direct positive impact here. In the example, a WPO improvement was implemented and you can clearly see the effect in the reduced download size.
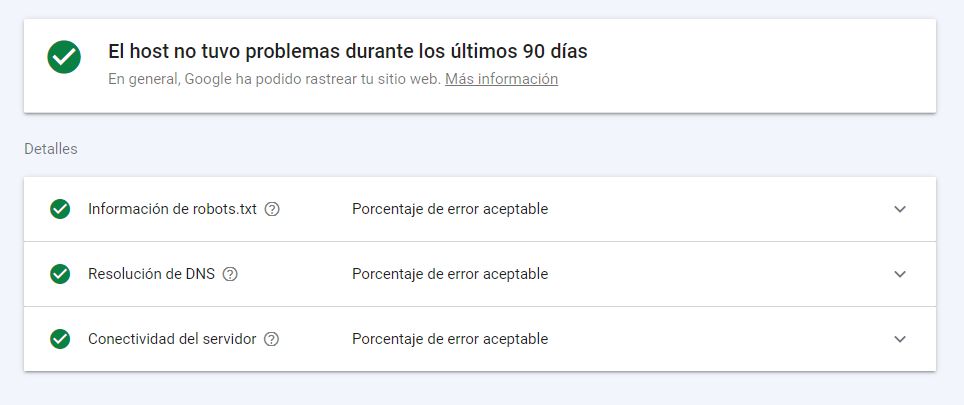
The Host status section shows whether Google has been able to access our site and robots.txt file correctly in the last 90 days. If this is not perfect, fixing it must be a high priority.
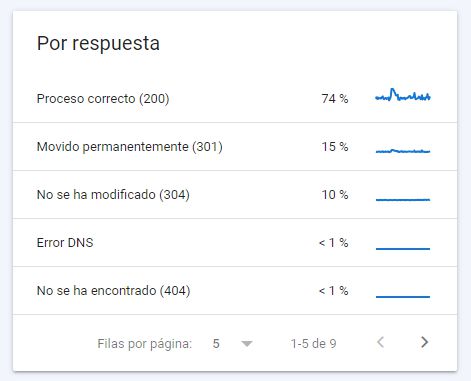
The second graph shows the response codes the bot has received. DNS errors and 5xx errors are particularly critical. And obviously, the more 200 responses, the better, since that means you are using your crawl budget efficiently. 4xx and 3xx codes are not necessarily bad, but if we can reduce them, even better.
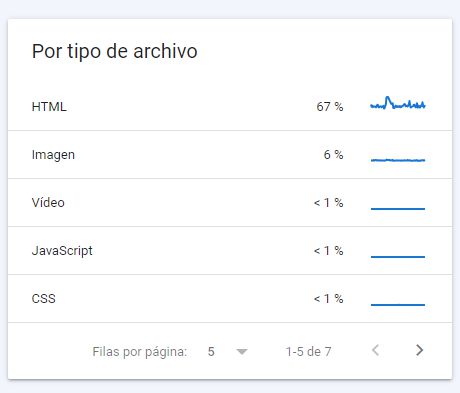
The third report shows the types of files Google encounters. For a typical website, most of them will be HTML, but it is normal to see JS, CSS, image files, PDFs, etc.
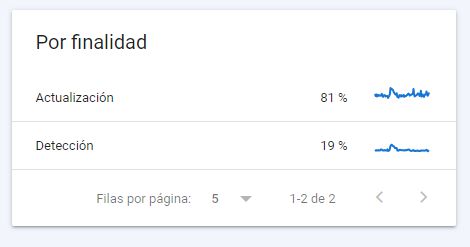
In the Purpose report, Google tells us whether the URLs crawled in recent days were new URLs (discovery) or whether it was re-crawling existing URLs to check for changes (refresh).
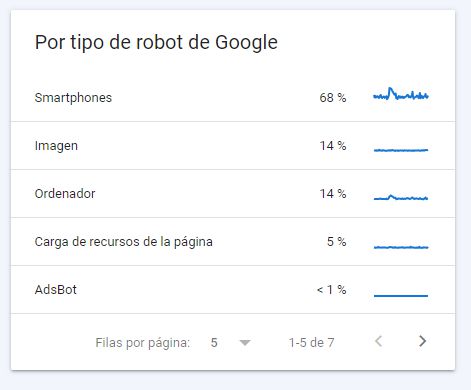
The By Googlebot type report gives us clues about which specific Googlebots are visiting our site. Today, most projects are primarily crawled by the Smartphone Googlebot, but depending on your content and your audience, other bots may also appear. You should keep this in mind and make sure your site is optimised accordingly. Update: Google has announced that this report will be removed from Search Console following the rollout of mobile-first indexing.
This section was introduced in November 2023. It is a place where we can check the status of our site’s robots.txt file and how Google has processed it.
In the first view, we see the file path, the last check date, whether it was retrieved correctly, the file size and any issues: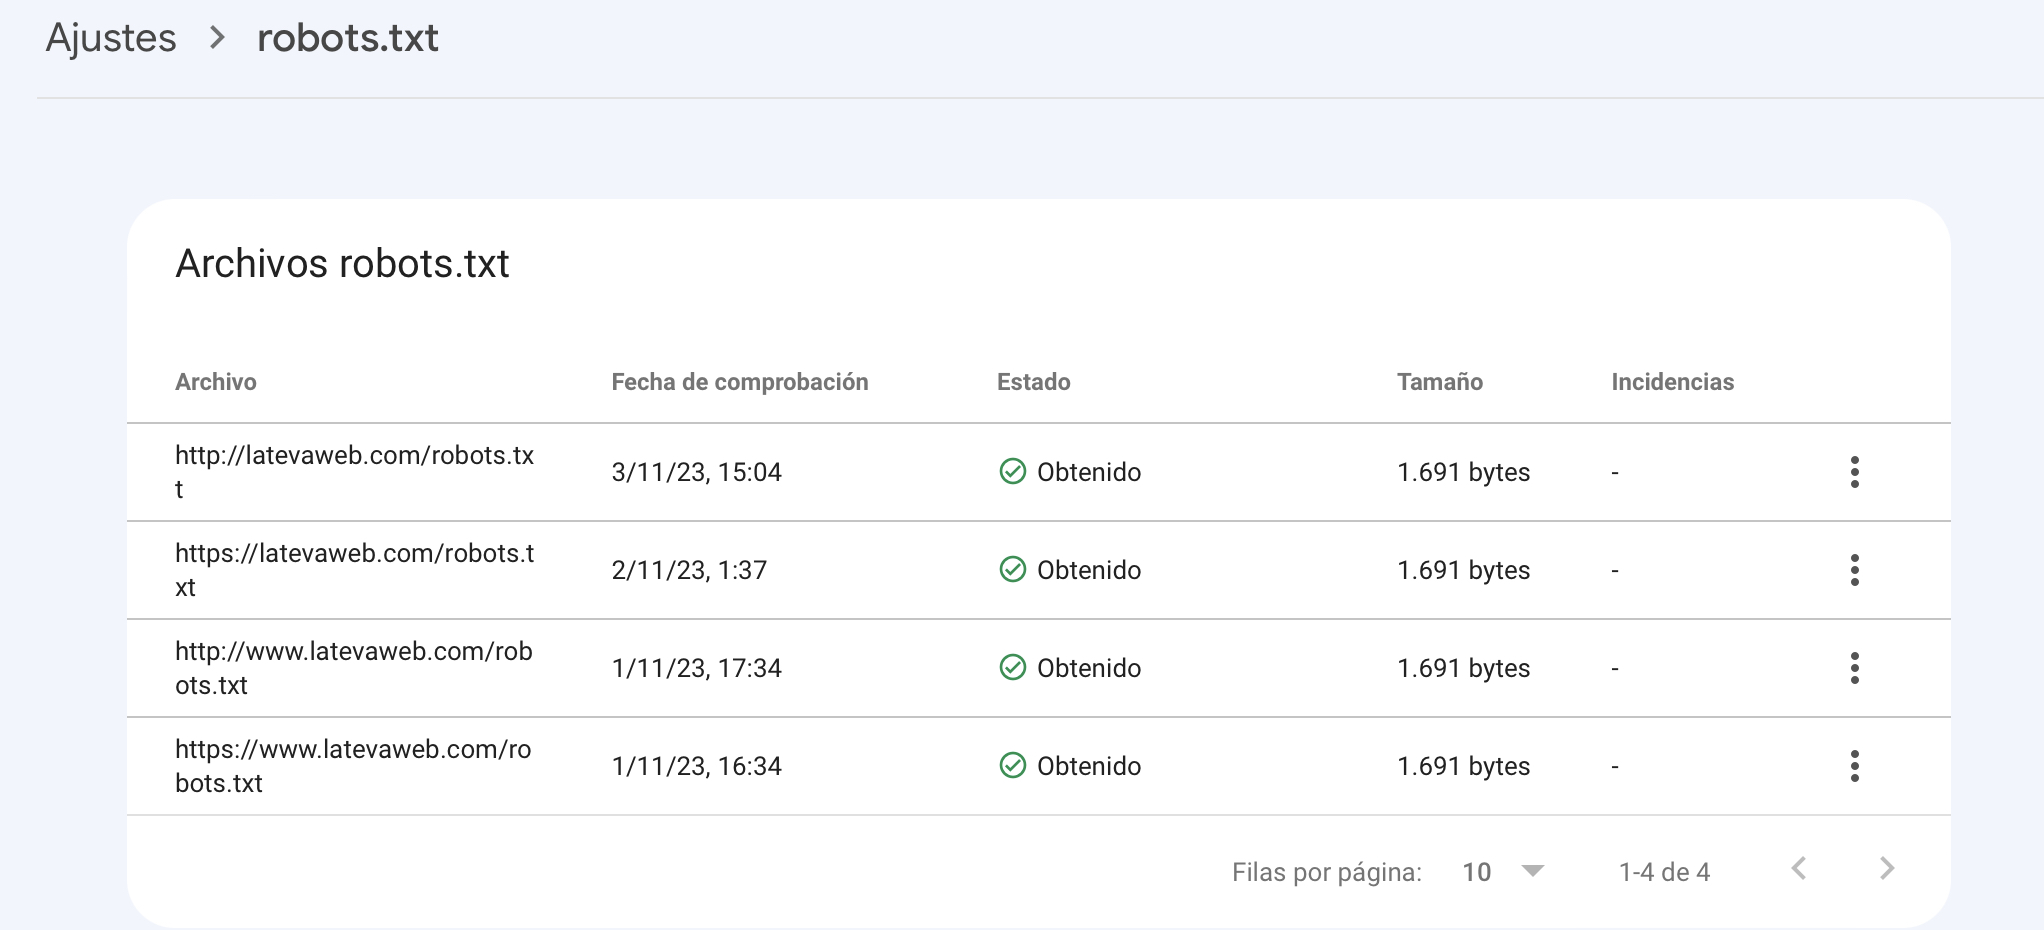
Clicking the three dots next to the last crawl, if we have made significant changes, we can request a re-crawl. We can also click to see the processed robots.txt file. At first glance this seems useful, but in practice it is mostly a read-only report. We also believe anything related to robots.txt should be reserved for advanced users (which is not always the case for whoever is looking at GSC). In addition, this new section came at the cost of losing a very popular tool: the old robots.txt tester, which is now gone. Overall the trade-off is negative, because Search Console now only tells us whether the file is retrieved correctly, but we can no longer test whether a specific URL is allowed or blocked; for that we must rely on external tools.
In this key section we get information about how other websites link to us and how we handle internal linking. It provides four reports, the first three related to external links:
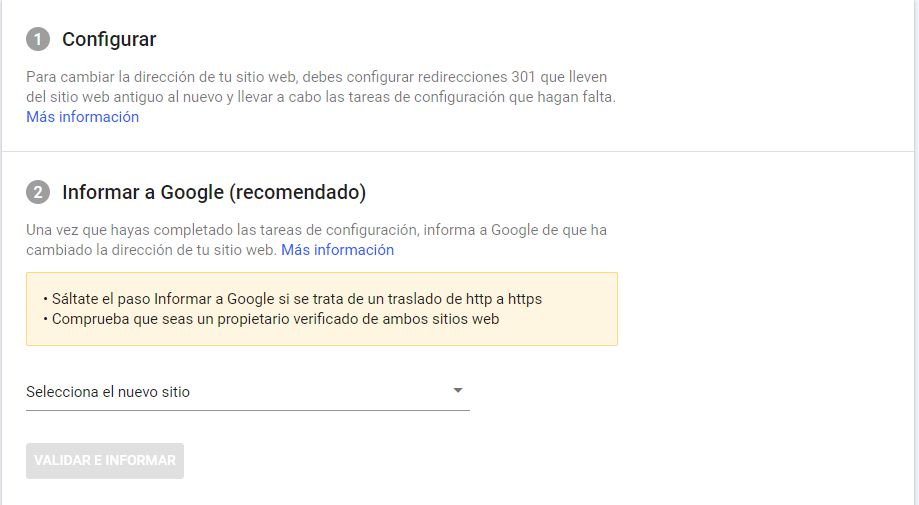
If your site is going to change domain, this is one of the mandatory steps in an SEO migration. To do it properly, you must:
There used to be a (very well hidden) option to limit how often Google could crawl your site:
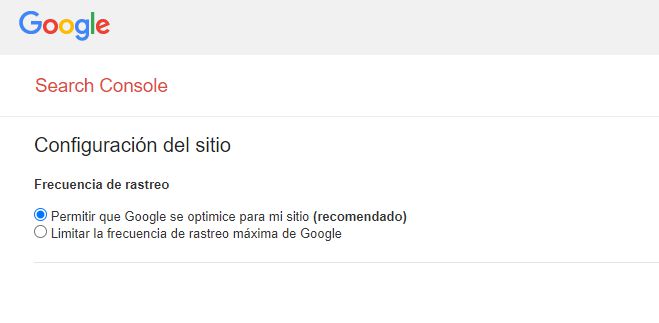
In 99% of cases this was never used, except when the bot was causing serious issues and only for very short, specific periods (flash campaigns, Black Friday, etc.). Because of that, and because Google’s own automated crawl management has improved, Google has announced the sunset of the Crawl Rate Limiter tool for January 2024.
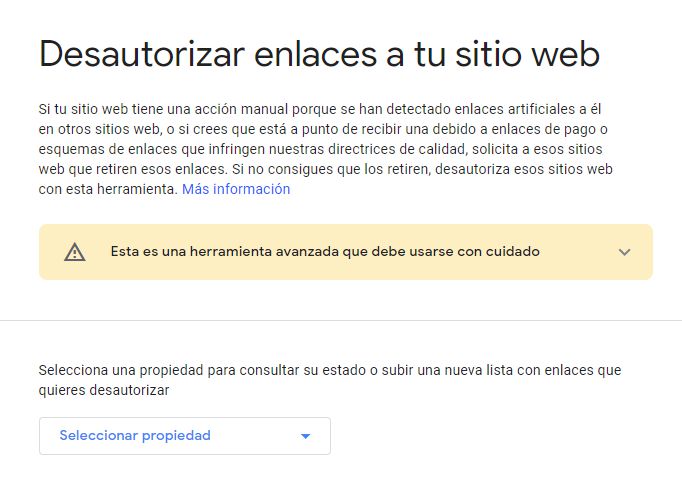
This is another deliberately hidden tool. It lets us upload a file listing links or entire domains whose links we want to disavow. In other words, we have detected links from spammy sites and we do not want Google to take them into account. If you are interested in this topic, check our post about Google’s Disavow tool.


Hello! drop us a line

Tips to get the most out of the only fully reliable SEO tool, provided directly by Google itself.